Session Prep

Two minutes tonight. A plan tomorrow.
Morning review · Updated Wed, Nov 18, 8:00 AM EST · All times Eastern
Deep research

This morning's one thing

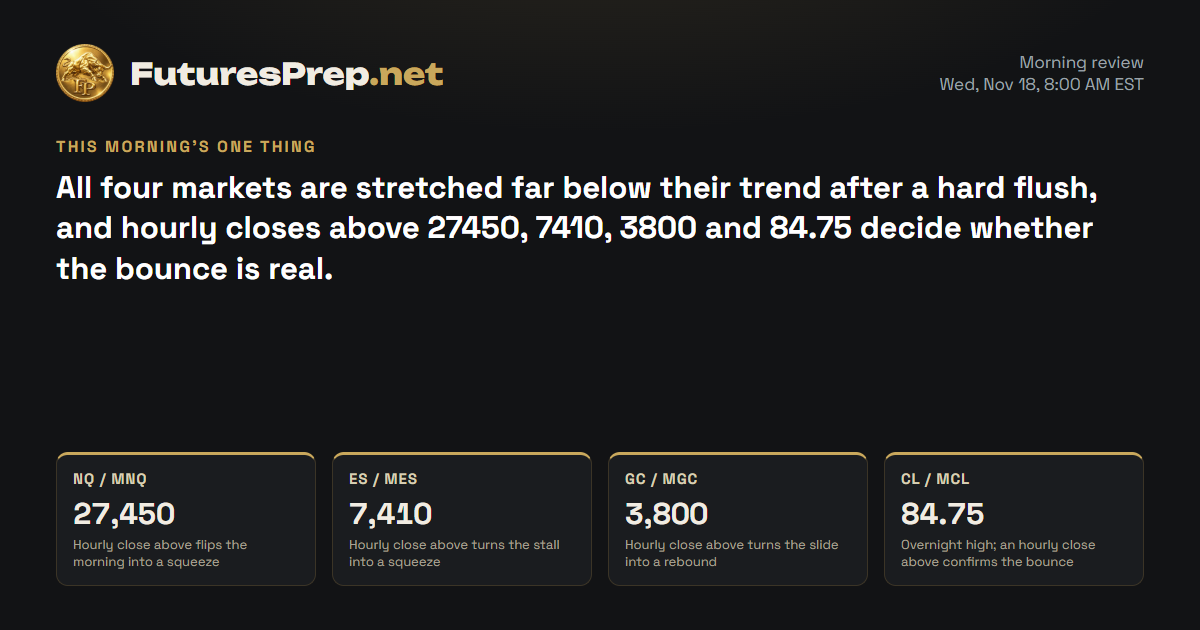
All four markets are stretched far below their trend after a hard flush, and hourly closes above 27450, 7410, 3800 and 84.75 decide whether the bounce is real.

Today's market movers · Wednesday, November 18

Time ETImpactEventForecastPrevious
2:00 PMHighFOMC Meeting Minutes——

U.S. releases, high and medium impact.

NQ / MNQE-mini / Micro E-mini Nasdaq-100Weekly thesis · FULFILLED

The Lines in the Sand

27,450Hourly close above flips the morning into a squeeze
27,094Overnight floor where the gap filled; bulls defend here
26,659This week's flush low; below it the floor is gone

The Trap

Bears pressing the overnight weakness toward 27094 get caught when the cash-open reaction to Nvidia squeezes price back through the 27400 shelf. In a stretched tape, crowded shorts are the fuel for fast snapbacks.

Last price27,317.75
ADR · 30 sessions757.46 pts
Daily EMA2128,427.25BELOW
Reopen gapUP · 256.75 ptsFilled
26,75027,00027,25027,50027,75028,00028,25028,50028,750Wed 9:30close 16:00Thu 9:30close 16:00Fri 9:30close 16:00Mon 9:30close 16:00Tue 9:30close 16:00Prior week high · 28,697.25Prior week low · 26,737.25H1 · EMA21 · NQ / MNQ 27,317.75Dashed: last night's path
Overnight: invalidated

The Read

INVALIDATED

Bears ran a hard flush to 26659 and broke last week's low of 26737.25, but they could not hold it. Price based around 26900-27090, closed back at 27124.5, and the reopen gapped higher. The chart still looks heavy, but price is stretched far below its 21-day average, and a selling day like yesterday's tends to partly reverse, so there is a slight lean higher. The risk is that price is still below that average, so the broader trend leans lower. Hold above 27124.5 and clear 27609.25 and the door opens; lose 26659 and the floor is gone.

Morning review · Nov 18, 7:30 AM EST

Bears have the tape for now: the hourly chart slipped back under the 27400 shelf to 27317.75, and the overnight gap filled at 27094. The chart looks heavy, but price is stretched far below its 21-day average, and yesterday's down candle tends to partly reverse. That gives bulls a slight edge. The risk is the bigger trend, which still points lower while price sits under that average. An hourly close above 27450 opens the squeeze door; a close below 27200 in the first 90 minutes of the cash session and the bears' grip tightens toward 27094.

Overnight evidence · 4 cited findings

Overnight price action

  • From the 18:30 baseline price ran to 27609.25, sold to 27094 and sits at 27317.75, net -63.5 points.
  • The 27400 shelf held 02:00-05:00 and failed at 06:00.

Overnight events

  • The Nvidia beat was live all session. No scheduled event fell inside the overnight window, and the next catalyst is the 09:30 cash open.

What changed

  • Net: the prior bounce read failed and the gap filled. price action stays bearish, with an Nvidia-led squeeze above 27450 as the main risk.
Yesterday's daily candle · Tue, Nov 17
Open27,312.75High27,498Low26,659Close27,124.5
bearish · range 839 pts
Projected range · next session300 pts27,340 – 27,640

Index drivers

Microsoft led Tuesday's heavyweight losses, and Meta and Alphabet also closed lower while Broadcom finished higher. Nvidia and Apple ended slightly lower, and Amazon and Tesla slightly higher. Morning headlines say tech is jumping on Nvidia's earnings, and no heavyweight has another report on the calendar.

Market data as of Nov 18, 7:32 AM EST · Weights as of 2026-09-30

Evidence · 12 cited findings

Price action · weekly / daily / H1

  • Chart read is bearish. The week is down (open 28059.5, close 27124.5), and the daily closed 1.72 ADR below the 21 EMA (28427.25) with a REJECT on 1.38x average volume.
  • The 10:00 H1 bar ran 27335 to 26659, followed by a base around 26900-27090. The 16:00 bar closed at 27124.5, and the Globex reopen gapped up 256.75 pts (0.34 ADR) to about 27381-27442.
  • The gap is unfilled. Its base rate is about 50% same-session fill (n=10, wide interval), so it gives no clear edge. The H1 ema21 is about 27200-27224, below the reopen.
  • Yesterday's bearish candle (body ratio 0.22) is one of the stretch signals, and price is well extended below its average, which favors a snap-back higher from the base. The first forming bar's high of 27609.25 is the nearest upside level to clear.

Metrics

  • Daily range was 1.108x ADR (ADR30 757.46) on 1.376x the 30-day average volume, which marks an exhaustion-type flush.
  • Close was 1.72 ADR below the 21 EMA, so price is stretched. It is also below the average, which is the main trend-side counter.
  • H1 is expanding (last range 247.75 vs threshold 105). Top expansion hours are 09:00-13:00 and 15:00 ET, so overnight expansion is not the base case apart from the London open.

Sentiment & current events

  • Nvidia reported Q3 FY27 after the close: revenue $115.8B vs $109.15B consensus, non-GAAP EPS $2.68, Data Center $107.6B, buyback raised by $150B. After-hours quote was $158.37 (+1.87%) vs the $155.46 close. Source: https://nvidianews.nvidia.com/news/nvidia-announces-financial-results-for-third-quarter-fiscal-2027. Guidance and the read reaction were not read.
  • Headline coverage read it a beat-and-raise: https://finnhub.io/api/news?id=77ae0515b89988860599b56afffe978f2e66186603e530c5cd958758af1fbb5c. Tuesday's closes: MSFT -2.27%, META -1.20%, GOOGL -1.24%, AVGO +2.46% (QQQ driver snapshot, weights as of 2026-09-30).
  • Cash close per a single Yahoo snapshot: Nasdaq Composite -0.74%, S&P 500 -1.03%, VIX 25.46 (+11.1%). This is not exchange-verified. https://finnhub.io/api/news?id=bd12f3fc93ef3750dbf604401e92c842d34b7046ec40e9a269dc6903ac1a9b86 covers the AI-stock selloff.
  • Reuters reports Trump is headed to China for talks with Xi, and Anthropic's IPO prices Wednesday and trades Thursday 11/19. Both are two-sided risks. Source: https://www.marketscreener.com/news/us-stock-futures-slip-ahead-of-nvidia-results-fed-speakers-in-focus-ce785edfd080fe22
  • Strongest contradiction: the chart read is bearish, but the read is for a snap-back from a stretched low. A failed Nvidia reaction or the Trump-Xi talks could reverse that.
Sources & evidence dates · 22
  1. Nvidia reported Q3 FY27 after the close on 11/17, so the earlier 'result not yet known' item is superseded. Revenue was $115.8B against a $109.15B consensus (+103% y/y, +20% q/q). Data Center revenue was $107.6B, non-GAAP EPS $2.68 and GAAP EPS $2.70 against $2.47 expected, and non-GAAP gross margin 74.9%. Vera Rubin NVL72 has shipped, and the buyback authorization was raised by $150B. A beat on revenue and EPS. NVDA after-hours quote was $158.37 (+1.87%) at 5:18 PM ET versus a $155.46 close. Guidance and the post-read reaction were not read.2026-11-17
  2. finance.yahoo.com2026-11-17
  3. marketscreener.com2026-11-17
  4. tradingeconomics.com2026-11-17
  5. Yahoo2026-11-18T11:57:09.000Z
  6. Yahoo2026-11-18T11:50:00.000Z
  7. Yahoo2026-11-18T11:47:02.000Z
  8. Yahoo2026-11-18T11:52:31.000Z
  9. Yahoo2026-11-18T11:16:50.000Z
  10. Yahoo2026-11-18T12:00:00.000Z
  11. Yahoo2026-11-18T11:05:52.000Z
  12. Yahoo2026-11-18T11:12:42.000Z
  13. Yahoo2026-11-18T11:06:12.000Z
  14. Yahoo2026-11-18T11:46:49.000Z
  15. Yahoo2026-11-18T11:13:23.000Z
  16. Yahoo2026-11-18T11:05:46.000Z
  17. Yahoo2026-11-18T11:37:42.000Z
  18. Yahoo2026-11-18T11:19:41.000Z
  19. Yahoo2026-11-18T11:49:50.000Z
  20. Yahoo2026-11-18T11:04:36.000Z
  21. Yahoo2026-11-18T11:24:19.000Z
  22. Yahoo2026-11-18T11:01:14.000Z
ES / MESE-mini / Micro E-mini S&P 500Weekly thesis · FULFILLED

The Lines in the Sand

7,410Hourly close above turns the stall into a squeeze
7,363.5Gap-fill low; a break early hands bears the morning
7,308This week's flush low and the last real floor

The Trap

Bulls who jump on the overnight Nvidia optimism keep running into the 7405-7410 shelf and get trapped as price fades under it. Bears who lean too hard toward 7308 risk getting squeezed if the shelf finally gives way.

Last price7,388.5
ADR · 30 sessions118.98 pts
Daily EMA217,593.61BELOW
Reopen gapUP · 39.25 ptsFilled
7,3007,3507,4007,4507,5007,5507,6007,6507,700Wed 9:30close 16:00Thu 9:30close 16:00Fri 9:30close 16:00Mon 9:30close 16:00Tue 9:30close 16:00Prior week high · 7,674.5Prior week low · 7,360.75H1 · EMA21 · ES / MES 7,388.5Dashed: last night's path
Overnight: invalidated

The Read

INVALIDATED

Bears punched through last week's low of 7360.75 with a wick to 7308, then got caught as the close came back to 7366.5 with no acceptance below. Since then price has built a higher-low base, and the reopen gapped right into the hourly average near 7402-7403. The chart looks heavy, but price is stretched far below its 21-day average, and yesterday's bearish candle tends to partly reverse, so there is a slight lean higher. The risk is that price is still below that average, so the broader trend leans lower, and a hold below 7402 would argue against the bounce. Clear 7435 and the door opens; lose 7308 and the floor is gone.

Morning review · Nov 18, 7:30 AM EST

Bulls tried overnight and stalled: price faded from 7409 to 7388.5, slipped under the hourly trend, and the gap filled at 7363.5. The chart looks heavy, but price is stretched far below its 21-day average, and yesterday's flush tends to partly reverse, so there's a slight tilt higher. The risk is that the broader trend still leans lower while price trades under that average. An hourly close above 7410 opens the squeeze door; a close below 7363.5 in the first 90 minutes of the cash session and 7340, then 7308, come into play.

Overnight evidence · 4 cited findings

Overnight price action

  • From the 18:30 baseline price ran to 7434.5, sold to 7363.5 and sits at 7388.5, net -17.25 points.
  • The 7405-7410 shelf is now resistance.

Overnight events

  • The Nvidia beat was live all session. The next catalyst is the 09:30 cash open.

What changed

  • Net: the prior bounce read failed and the gap filled. price action stays bearish, with a squeeze above 7410 as the main risk.
Yesterday's daily candle · Tue, Nov 17
Open7,441.5High7,457Low7,308Close7,366.5
bearish · range 149 pts
Projected range · next session62 pts7,398 – 7,460

Index drivers

Microsoft was the heaviest drag on Tuesday, and Alphabet, Meta, Micron and Berkshire Hathaway also closed lower. Broadcom bucked the move and finished higher, while Nvidia ended slightly lower. Morning headlines say tech is jumping on Nvidia's earnings, and no heavyweight has another report on the calendar.

Market data as of Nov 18, 7:32 AM EST · Weights as of 2026-10-01

Evidence · 12 cited findings

Price action · weekly / daily / H1

  • Chart read is bearish. The week is down (open 7577.5, close 7366.5). It took the prior-week low of 7360.75 via the 7308 wick, and the 16:00 bar closed back above it at 7366.5, so there is no acceptance below.
  • The 10:00 flush (7435 to 7308) was followed by a higher-low base around 7316-7390. The reopen gapped up 39.25 pts (0.33 ADR) to about 7405-7434, right at the H1 ema21 near 7402-7403.
  • The gap fill base rate is about 55% (n=11, wide interval), so it gives no edge.
  • Daily is 1.91 ADR below the 21 EMA (7593.61) after a bearish candle (body ratio 0.50). Price is stretched and expected to snap back. 7435 is the nearest upside level to clear.

Metrics

  • Daily range was 1.252x ADR (ADR30 118.98) on 1.491x the 30-day average volume, a flush-type day.
  • Close was 1.91 ADR below the 21 EMA, which is stretched. Price is below the average, which is the broader-trend counter.
  • H1 is expanding (last range 39.75 vs threshold 18.5). Top expansion hours are 09:00-13:00 and 15:00 ET.

Sentiment & current events

  • Nvidia beat on revenue and EPS after the close, with after-hours +1.87% (S&P weight about 8.45%, 10/01). https://nvidianews.nvidia.com/news/nvidia-announces-financial-results-for-third-quarter-fiscal-2027. Guidance was not read.
  • Headline coverage: https://finnhub.io/api/news?id=77ae0515b89988860599b56afffe978f2e66186603e530c5cd958758af1fbb5c. Tuesday's closes: MSFT -2.27%, GOOGL -1.24%, META -1.20%, MU -0.92%, AVGO +2.46%.
  • Cash close per a Yahoo snapshot: S&P 500 7,340.53 (-1.03%), VIX 25.46. This is not exchange-verified. Intraday weakness faded into the close.
  • Trump-Xi talks and the Anthropic IPO (prices Wednesday, trades Thursday) are two-sided risks through 11/19. https://www.marketscreener.com/news/us-stock-futures-slip-ahead-of-nvidia-results-fed-speakers-in-focus-ce785edfd080fe22
  • Strongest contradiction: the chart read is bearish, but the read is for a snap-back. A hold below the H1 ema21 near 7402 would argue against it.
Sources & evidence dates · 28
  1. Nvidia reported Q3 FY27 after the close on 11/17, so the earlier 'result not yet known' item is superseded. Revenue was $115.8B against a $109.15B consensus (+103% y/y, +20% q/q). Data Center revenue was $107.6B, non-GAAP EPS $2.68 and GAAP EPS $2.70 against $2.47 expected, and non-GAAP gross margin 74.9%. Vera Rubin NVL72 has shipped, and the buyback authorization was raised by $150B. A beat on revenue and EPS. NVDA after-hours quote was $158.37 (+1.87%) at 5:18 PM ET versus a $155.46 close. Guidance and the post-read reaction were not read.2026-11-17
  2. finance.yahoo.com2026-11-17
  3. marketscreener.com2026-11-17
  4. tradingeconomics.com2026-11-17
  5. Yahoo2026-11-18T11:57:09.000Z
  6. Yahoo2026-11-18T11:50:00.000Z
  7. Yahoo2026-11-18T11:47:02.000Z
  8. Yahoo2026-11-18T11:52:31.000Z
  9. Yahoo2026-11-18T11:16:50.000Z
  10. Yahoo2026-11-18T12:00:00.000Z
  11. Yahoo2026-11-18T11:05:52.000Z
  12. Yahoo2026-11-18T11:12:42.000Z
  13. Yahoo2026-11-18T11:06:12.000Z
  14. Yahoo2026-11-18T11:46:49.000Z
  15. Yahoo2026-11-18T11:13:23.000Z
  16. Yahoo2026-11-18T11:05:46.000Z
  17. Yahoo2026-11-18T11:37:42.000Z
  18. Yahoo2026-11-18T11:19:41.000Z
  19. Yahoo2026-11-18T11:49:50.000Z
  20. Yahoo2026-11-18T11:04:36.000Z
  21. Yahoo2026-11-18T11:24:19.000Z
  22. Yahoo2026-11-18T11:01:14.000Z
  23. Yahoo2026-11-18T11:52:11.000Z
  24. Yahoo2026-11-18T11:07:03.000Z
  25. Yahoo2026-11-18T11:04:32.000Z
  26. Yahoo2026-11-18T05:20:28.000Z
  27. Yahoo2026-11-18T04:02:39.000Z
  28. Yahoo2026-11-18T03:13:25.000Z
GC / MGCGold / Micro GoldWeekly thesis · FULFILLED

The Lines in the Sand

3,800Hourly close above turns the slide into a rebound
3,759.5Session low; a break here re-arms the bears
3,735Next shelf down if 3759.5 gives way

The Trap

Late bears pile in at the lows after a long one-way grind, right where an overextended market tends to snap back toward 3790-3800. Bulls trying to read the bottom get flushed if 3759.5 breaks.

Last price3,766.5
ADR · 30 sessions82.13 pts
Daily EMA214,013.05BELOW
Reopen gapUP · 4.9 ptsFilled
3,7503,8003,8503,9003,9504,0004,0504,100Wed 8:20close 13:30Thu 8:20close 13:30Fri 8:20close 13:30Mon 8:20close 13:30Tue 8:20close 13:30Prior week low · 3,856.2H1 · EMA21 · GC / MGC 3,766.5Dashed: last night's path
Overnight: invalidated

The Read

INVALIDATED

Bears own the week: gold accepted below last week's low of 3856.2 and stepped down in lower highs from 3878.4 to 3860.7 into a 3851.6 close. But the daily printed a doji on ordinary volume, so the slide is losing speed. The chart looks heavy, but price is stretched far below its 21-day average, and that rubber band gives a slight lean higher, the thinnest bounce case on the board. The risk is that price is still below that average, so the broader trend leans lower, and a hawkish Fed backdrop is a headwind. Reclaim 3856.2 and the door cracks open; a close below 3839 and a loss of 3835 means the floor is gone.

Morning review · Nov 18, 7:30 AM EST

Bears have dragged gold below the prior-week low of 3856.2 and kept it there, grinding down to 3766.5, just above the 3759.5 session low. This is the cleanest downtrend on the board, and the chart looks heavy. But price is stretched far below its 21-day average, and that rubber band gives bulls a slight edge. The risk is that the broader trend still points lower. An hourly close above 3800 and the rebound has room to run; a close below 3759.5 early in the session and 3735 is next.

Overnight evidence · 3 cited findings

Overnight price action

  • From the 18:30 baseline price ran to 3859.5 and sold to 3759.5, net -90 points.

Overnight events

  • Gold dropped about 2% to a one-year low with a firm dollar and hike pricing cited.

What changed

  • Net: the bounce read was invalidated. price action stays bearish but is extended, so a rebound toward 3790-3800 is the main risk.
Yesterday's daily candle · Tue, Nov 17
Open3,858.7High3,894.1Low3,839.2Close3,851.6
doji · range 54.9 pts
Projected range · next session15.5 pts3,850.5 – 3,866
Evidence · 10 cited findings

Price action · weekly / daily / H1

  • Chart read is bearish. The week is down (open 3869.4, close 3851.6) with acceptance below the prior-week low of 3856.2. The H1 structure is a staircase of lower highs, from 3878.4 at 10:00 to 3860.7 at 16:00, below the H1 ema21 near 3863.
  • Daily closed as a doji (body ratio 0.13), 1.97 ADR below the 21 EMA (4013.05) on average volume (0.98x), so the downtrend has slowed.
  • The reopen gapped up only 4.9 pts (0.06 ADR). The base rate is about 96% same-session fill (n=48), so a dip to 3851.6 is likely before any bounce. The forming 18:00 bar is at 3856.2.
  • Price is stretched below its average and is expected to snap back, but this is the lowest-conviction snap-back of the four. The 3839.2 daily low and the weekly low of 3835 are the downside references.

Metrics

  • Daily range was 0.668x ADR (ADR30 82.13), which is not an exhaustion-size range.
  • Close was 1.97 ADR below the 21 EMA, which is stretched. Price is below the average, which is the broader-trend counter.
  • H1 is not expanding (last range 12.2 vs threshold 23.9, 6 bars since expansion).

Sentiment & current events

  • Dec gold futures settled $3,853 (-0.9%) and spot ended near $3,848.51 after a low of $3,830, the lowest since Oct 2025. Several sources describe gold holding or edging up from that low, so it is a drift, not a washout. https://tradingeconomics.com/commodity/gold
  • CME FedWatch is cited at about 93% for +25bp and 7% for +50bp in December, with hawkish comments from Musalem and Hammack. This is a headwind for a bounce and is context only.
  • Strongest contradiction: the chart read is bearish and the hawkish Fed backdrop leans lower, so the snap-back read is the weakest of the four. A close below 3839 would extend the weekly leg.
Sources & evidence dates · 2
  1. Gold: Dec futures settled $3,853 (-0.9%) and spot ended near $3,848.51 after a low of $3,830 (lowest since Oct 2025). This matches the price action's MGC reopen near 3856 and downtrend. CME FedWatch is cited at about 93% for +25bp and 7% for +50bp in December, and Musalem and Hammack are hawkish, which supports the MGC bearish bias. Several sources describe gold as holding or edging up from the low, so the evidence is a drift lower, not a washout.2026-11-17
  2. tradingeconomics.com2026-11-17
CL / MCLWTI Crude Oil / Micro WTI Crude OilWeekly thesis · FULFILLED

The Lines in the Sand

84.75Overnight high; an hourly close above confirms the bounce
83.2Lose it in the morning and the slide resumes
82.34Heavy-volume flush low; possibly where liquidation ran out

The Trap

Traders who chased the overnight break below 82.84 got caught when price snapped back with no follow-through. The 10:30 ET inventory report can whip price through both sides of 84.1-84.6 within minutes.

Last price83.92
ADR · 30 sessions3.7 pts
Daily EMA2189.81BELOW
Reopen gapDOWN · -0.14 ptsFilled
8283848586878889Wed 9:00close 14:30Thu 9:00close 14:30Fri 9:00close 14:30Mon 9:00close 14:30Tue 9:00close 14:30Prior week low · 82.84H1 · EMA21 · CL / MCL 83.92Dashed: last night's path

The Read

Bears dragged crude down from 88 to 83.41 but never reached last week's low of 82.84, and the daily closed slightly higher at 84.42. Now price is coiled in an 83.41-85.97 box, sitting on its hourly average, and volume was unusually heavy for such a modest range. Price is stretched far below its 21-day average, and that rubber band gives a slight lean higher, though the edge is thin. The risk is that price is still below that average, so the broader trend leans lower. Hold 83.41 and clear 85.97 and the door opens; lose 83.41 and 82.84 is the next floor.

Morning review · Nov 18, 7:30 AM EST

Bears flushed crude to 82.34 on heavy volume, breaking the prior-week low of 82.84. Bulls then dragged it back to 83.92 over four straight rising hourly closes. Price is stretched far below its 21-day average, and that rubber band leans slightly higher. The risk is that the broader trend still points lower, and the 10:30 ET inventory report is the wildcard. An hourly close above 84.75 opens the bounce door; a close below 83.2 in the morning window and 82.34 is back in play.

Overnight evidence · 4 cited findings

Overnight price action

  • From the 18:30 baseline price ran to 84.75, sold to 82.34 and recovered to 83.92, net -0.36.
  • The recovery has stalled at the H1 average of about 83.87.

Overnight events

  • WTI fell about 2.1% on the API build and supply-glut concerns, while Gulf attacks limited the losses.

What changed

  • Net: the prior bullish read is adjusted. price action stays bearish but weak, and the 10:30 EIA print is the main two-sided risk.
Yesterday's daily candle · Tue, Nov 17
Open83.84High85.97Low83.41Close84.42
bullish · range 2.56 pts
Projected range · next session0.9 pts84.2 – 85.1
Evidence · 10 cited findings

Price action · weekly / daily / H1

  • Chart read is flat. The week is down (open 87.46, close 84.42), but the prior-week low of 82.84 has not been taken, so about 1.6 pts of room remain. The 11/17 daily closed slightly bullish (83.84 to 84.42).
  • H1 has stabilised in an 83.41-85.97 range after the slide from 88. Price is at the H1 ema21 (about 84.75). The last bar range of 0.35 vs a 0.82 expansion threshold means compression.
  • The reopen gap of 0.14 pts (0.038 ADR) was already filled, so it is not applicable. The 93% same-session fill base rate carries no information here.
  • Daily is 1.46 ADR below the 21 EMA (89.81) on 2.88x the 30-day average volume. Price is stretched and expected to snap back, with a weak edge. A close below 83.41 would resume the downtrend toward 82.84.

Metrics

  • Daily range was 0.692x ADR (ADR30 3.7) on 2.88x average volume, which is unusually heavy for a modest range.
  • Close was 1.46 ADR below the 21 EMA, which is stretched. Price is below the average, which is the broader-trend counter. Yesterday's bullish candle leans the other way, so the edge is small.
  • H1 is not expanding (2 bars since expansion). The top expansion hours are 08:00-12:00 and 04:00 ET.

Sentiment & current events

  • WTI Dec settled $85.72 (-3.21%) and Brent Jan $92.44 (-3.55%) on 11/16 per Xinhua. The 11/17 settle was not retrieved. https://english.news.cn/20261117/5eaba97d75cf4fcebd988f6cfc8e2d1c/c.html
  • The MCL levels (84.4-84.6) sit about $1 below the quoted WTI settle and Yahoo's Dec crude 85.61. This was not reconciled and may reflect the contract month or session.
  • Strongest contradiction: the flat chart read and the weekly bearish weekly view against a snap-back read that has the thinnest edge. A break below 83.41 would end it.
Sources & evidence dates · 1
  1. Crude: WTI Dec settled $85.72 (-$2.84, -3.21%) and Brent Jan $92.44 (-3.55%) on 11/16 per Xinhua (NYMEX/ICE). Brent was near $91.9 on 11/17. The price action's MCL base around 84.4-84.6 sits about $1 below the WTI settle. That gap reflects the contract month or session being compared and was not reconciled. A 11/17 settle was not retrieved.2026-11-17

Free. Always. Futures trading edge in your inbox.

You're in. Watch your inbox.

We do not send junk mail. We do not spam.