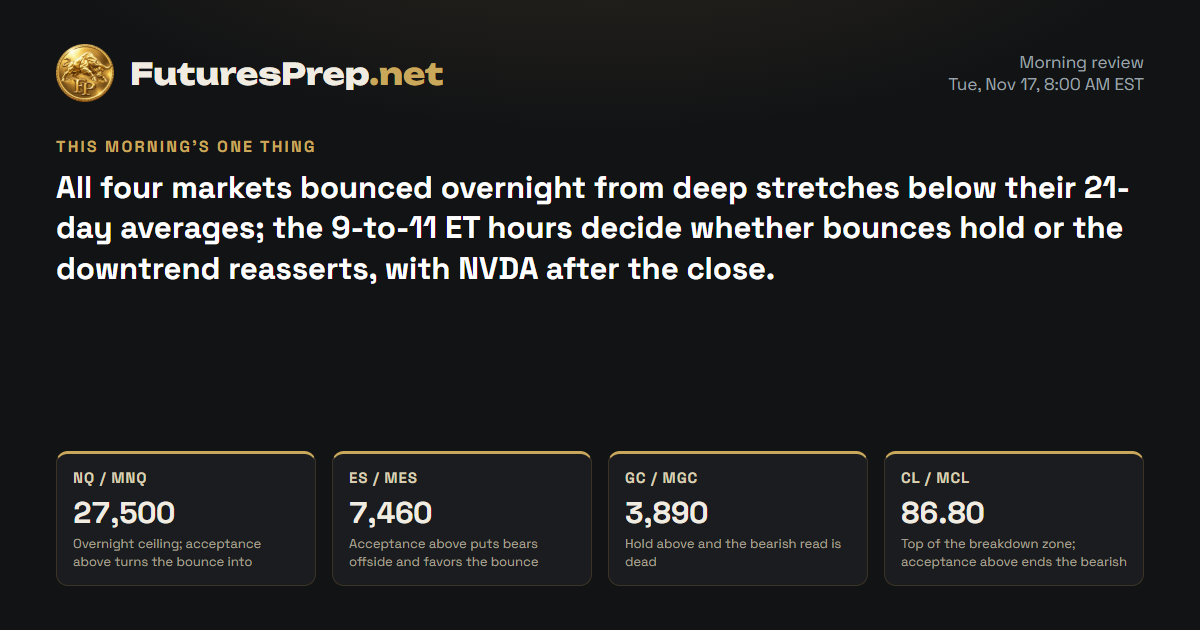
The Lines in the Sand
The Trap
The overnight push under the evening low pulled in late shorts, and the 06:00 short-covering burst ripped price back toward 27498. The mirror trap is chasing that thin-volume pop into 27500 right before the busiest hours, with no acceptance above it yet.
The Read
Bears marched price down a staircase of lower highs from 28279 to 27234.75 and closed it at 27285.5, almost on the low. Since then the hourly bars have shrunk, and the floor at 27234.75 is holding. The chart looks heavy, but price is stretched far below its 21-day average, and a red day that big tends to partly reverse. Those two forces give a slight tilt toward a bounce. The risk is plain: price still trades below that average, so the broader trend leans lower and any lift is a bounce inside a red week. Hold above 27234.75 and the door opens toward 27500; lose 27234.75 on a close and the floor is gone.
Morning review · Nov 17, 7:30 AM EST
Bears own the week: Monday's heavy drop was turned away at the 21-day average of 28559.3, and overnight price sank to 27084.75 before bulls ran a short-covering bounce back to 27440.75 on thin volume. The chart looks heavy, but price is stretched far below its 21-day average and yesterday's hard drop tends to partly reverse, so there's a slight tilt higher. The risk is that price still trades under that average, where the bigger trend points lower. Hold above 27500 and the door opens to a real recovery; a 9-to-11 ET close below 27350 says the bounce is fading and 27250 comes back into play.
Overnight evidence · 5 cited findings
Overnight price action
- Overnight from 18:00 ET: high 27498, low 27084.75 (04:00 bar), net +128 points, 0.559 ADR. Closes stepped down from 27404.5 at 23:00 to 27198 at 05:00, then the 06:00 bar expanded 292.25 points to close 27440.75.
- The prior-evening snapback line of 27234.75 was closed below at 04:00 and 05:00 and reclaimed at 06:00. The overnight range was not on heavy volume (0.36x).
Overnight events
- Morning headlines: the Italy fine on Meta and a report that the Nvidia board rules out a Huang return. Asia and Europe session reactions were not retrieved.
What changed
- Overnight price delivered the evening bounce direction after a deeper undercut, so the evening read is carried as adjusted. price action now reads bearish at the bounce high, and the divergence from the carried bullish read is flagged rather than resolved here.
- Event risk is two-sided: retail sales at 8:30 and NVDA after the close can extend or fail the bounce. Expected path and candle are scenario projections, not observations.
Index drivers
| Ticker | Approx. weight | Day move | Next earnings | Top headline |
|---|---|---|---|---|
| NVDA | 8.4% | −4.12% | Nov 17 · After close | Billionaire David Tepper Dumps AMD Stock, Makes $172 Million Bet on Oracle |
| MSFT | 5.75% | −1.12% | — | iShares Core Dividend Growth (DGRO) Buys $4.2 Million More Apple on Nov. 13 |
| AAPL | 7.28% | −0.98% | — | What iShares S&P 500 Value ETF (IVE) Sold: Apple Leads on Nov. 13 |
| AMZN | 4.04% | −3.34% | — | Can Trade Desk Stock Double From Here? |
| META | 3.26% | −2.38% | — | A Fund With $1 Billion in US Equities Just Bought These 3 Stocks |
| AVGO | 2.47% | −3.92% | — | Billionaire David Tepper Dumps AMD Stock, Makes $172 Million Bet on Oracle |
| GOOGL | 3% | −4.07% | — | Quaise Energy Signs 50 MW Geothermal Power Purchase Agreement with Google |
| TSLA | 2.81% | −2.69% | — | Nvidia Board Reportedly Rules Out Jensen Huang Return Despite Growing Support Campaign |
Every heavyweight in the feed closed lower Monday, with Alphabet, Nvidia and Broadcom taking the hardest hits and Apple and Microsoft the lightest. Amazon, Tesla and Meta also fell, and Meta drew headlines over an Italian fine. Nvidia reports fiscal third-quarter results after today's close.
Market data as of Nov 17, 7:32 AM EST · Weights as of 2026-09-30
Evidence · 14 cited findings
Price action · weekly / daily / H1
- Chart read is heavy: W47 is red (open 28059.5, last 27285.5). Today's daily candle was bearish with a 0.74 body ratio, closed at 27285.5 near the 27234.75 low, used 1.41 ADR, and was rejected at the 21-day average of 28559.3 on 1.1x average volume.
- H1 is a staircase of lower highs from 28279 down to 27234.75. The last completed hour was compressed (85.5 pts vs a 105 expansion threshold) and held above the low. The forming 18:00 bar is open 27312.75, high 27361, low 27217.25, last 27264.5 (incomplete).
- The read leans higher on two drivers. Price closed 1.72 ADR below its 21-day average, so it is stretched and expected to snap back. Today's bearish candle also tends to partly reverse. The chart looks heavy, but the stretch and the candle reversal carry the read.
- Strongest counter: price is below its 21-day average, so the broader trend leans lower. Read this as a bounce inside a red week, not a trend reversal.
- Scenario path: drift up toward 27450-27500 into the 02:00-04:00 ET window. A close below 27234.75 would break the snapback.
Metrics
- Engine data is tier A and valid (1.5h old, no staleness reasons). ADR30 is 739.75. Today's range used 1.41 ADR, body was 1.05 ADR, volume 1.115x the 30-day average.
- Reopen gap is UP 27.25 pts (0.037 ADR) and was already filled on the reopen tape (prior close 27285.5). Base rate is 87.13% same-session fill, median 1h, n=101. The only open gap in inventory is 29217.75 (10/30), far above and not relevant tonight.
- Weekly refs: prior-week high 28697.25 not taken, prior-week low 26737.25 untouched, prior-week close 27927.5. Weekly thesis RED is FULFILLED with flag OVERSHOOT_BEYOND_DECLARED_ZONE. Invalidation 28400 has not been closed or accepted through.
- Rates context (not a cause of direction): 10Y about 5.13-5.154%, DXY about 103.4, VIX 20.57 pre-market vs 19.30 Friday close. This is a pre-market snapshot. https://swingfolio.com/daily/us/2026-11-16/morning
- Limitation: no official 11/16 settlements for ES/NQ/MNQ/MES were retrieved. The Investing.com US Tech 100 snapshot (27,170.9) has an unknown timestamp and is not used as a level.
Sentiment & current events
- NVDA closed -4.12% (16:00 ET quote). Q3 earnings are Tue 11/17 after close (about 4:20pm ET, EPS est 2.525), outside this window but a live headline risk. The CEO transition is verified by the 8-K: Huang resigned and Kress is interim CEO/CFO. https://finnhub.io/api/news?id=2edf526c53fffb489b4fd932383622e04c631b5767a07e7b220bcac87dfa74ad https://nvidianews.nvidia.com/news/nvidia-announces-ceo-transition
- Mega-cap weakness was broad: GOOGL -4.07%, AVGO -3.92%, AMZN -3.34%, TSLA -2.69%, META -2.38%, MSFT -1.12%, AAPL -0.98%. Headline: Nasdaq and S&P 500 fall for a third day. https://finnhub.io/api/news?id=9a5d663c0841a474a9d06c1cb3a2d3a640322fa8a9246b7e99320ae21dad28c2
- Fed context: a Dec 9 hike is priced at about 91-94% for +25bp (CME FedWatch via Admirals/Reuters/Yahoo). This is a rate headwind for growth. It is context and risk only. https://admiralmarkets.com/analytics/traders-blog/fed-december-rate-hike-treasury-yields-retail-sales
- Not used as evidence: the Empire State print (7.8 vs about 17 consensus) was flagged as an old market snapshot and ineligible.
Sources & evidence dates · 24
- Dec 9 Fed hike is priced as near-certain. CME FedWatch via Yahoo/Reuters on 11/16 gave 91.1% for +25bp and 8.9% for +50bp, with hold about 0%. Yahoo's gold article cited 93.4%. Capital Street cited 94%/6%. The 88.8%/11.2% figure was from 11/10. Fed funds target is 3.75–4.00%. The October vote was 10–2 to hold.2026-11-16
- zacks.com2026-11-16
- nvidianews.nvidia.com2026-11-12
- capitalstreetfx.com2026-11-16
- swingfolio.com2026-11-16
- Fed Chair Warsh spoke Monday 12:00 ET on AI and productivity and did not address near-term rate policy. The Tuesday retail sales consensus of +0.2% (prior +0.8%) is corroborated. Other releases: industrial production 9:15, FOMC minutes Wed 2:00pm ET, and a Philly Fed consensus of 19.2.2026-11-16
- orderflowfutures.com2026-11-16
- wellsfargoadvisors.com2026-11-16
- Yahoo2026-11-17T11:56:25.000Z
- Yahoo2026-11-17T11:46:00.000Z
- Yahoo2026-11-17T11:44:40.000Z
- Yahoo2026-11-17T11:04:51.000Z
- Yahoo2026-11-17T11:04:21.000Z
- Yahoo2026-11-17T11:04:15.000Z
- Yahoo2026-11-17T11:05:06.000Z
- Yahoo2026-11-17T11:29:45.000Z
- Yahoo2026-11-17T11:05:14.000Z
- Yahoo2026-11-17T11:39:25.000Z
- Yahoo2026-11-17T11:32:47.000Z
- Yahoo2026-11-17T11:40:04.000Z
- Yahoo2026-11-17T11:16:11.000Z
- Yahoo2026-11-17T11:50:00.000Z
- Yahoo2026-11-17T11:24:57.000Z
- Yahoo2026-11-17T11:02:56.000Z