Session Prep

Two minutes tonight. A plan tomorrow.
Evening edition · Updated Sun, Nov 15, 7:00 PM EST · All times Eastern
Deep research

Tonight's one thing

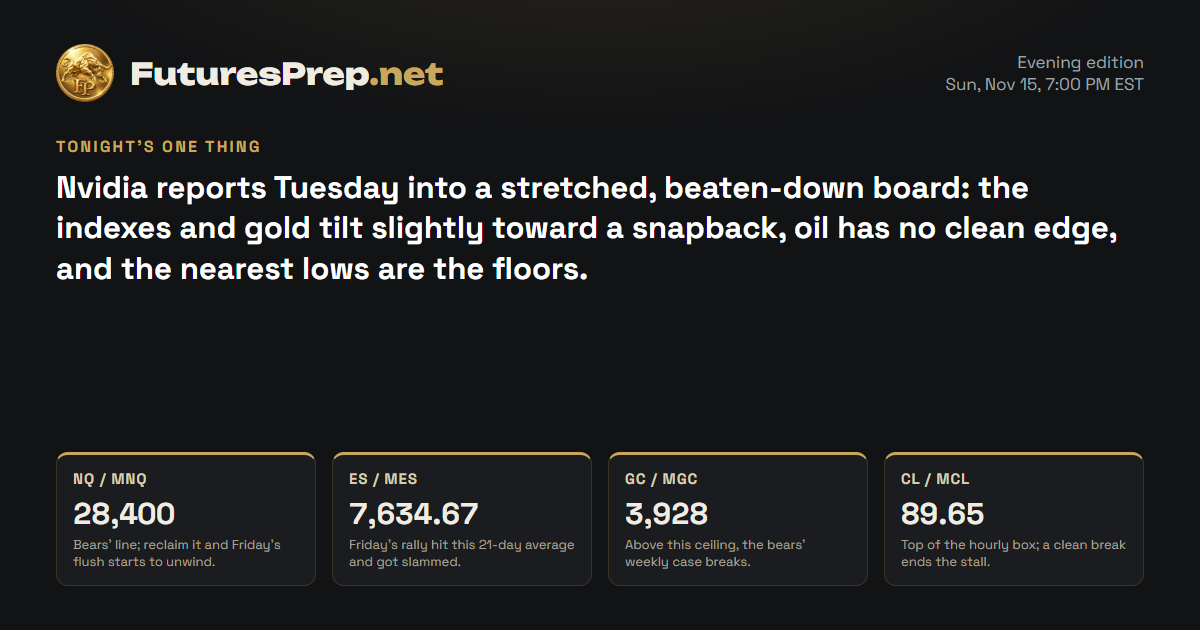
Nvidia reports Tuesday into a stretched, beaten-down board: the indexes and gold tilt slightly toward a snapback, oil has no clean edge, and the nearest lows are the floors.

Tomorrow's market movers · Monday, November 16

Time ETImpactEventForecastPrevious
12:00 PMHighFed Chairman Warsh Speaks——

U.S. releases, high and medium impact.

NQ / MNQE-mini / Micro E-mini Nasdaq-100Weekly thesis · INTACT

The Lines in the Sand

28,400Bears' line; reclaim it and Friday's flush starts to unwind.
27,927.5Friday's close and the open Sunday gap waiting below.
27,690.5Friday's low; lose it and the floor is gone.

The Trap

Shorts who pile on after Friday's flush get caught when a stretched market snaps back toward 28400. Late longs who chase the Sunday gap get caught when price slides back to fill 27927.5, which happens about as often as not.

Last price27,927.5
ADR · 30 sessions718.68 pts
Daily EMA2128,687.14REJECT
Reopen gapUP · 132 ptsOpen · 0.184 ADR
26,75027,00027,25027,50027,75028,00028,25028,50028,750close 16:00Mon 9:30close 16:00Tue 9:30close 16:00Wed 9:30close 16:00Thu 9:30close 16:00Fri 9:30close 16:00Gap fill · 27,927.5H1 · EMA21 · NQ / MNQ 28,190Yellow: 09:30 open · dashed gray: 16:00 close (ET)

The Read

Bears won Friday. The rally died at the 21-day average at 28687.14 and a morning flush dragged price to a 27927.5 close. Sunday's reopen gapped up to 28190, and bulls are already testing whether late shorts are offside. The broader trend still leans lower, and that is the risk, but price is stretched far below its 21-day average and a drop like Friday's tends to partly reverse, so the tilt is slightly upward. Hold above 28400 and the door opens back toward 28687.14; lose 27690.5 and the floor is gone.

Yesterday's daily candle · Fri, Nov 13
Open28,399.5High28,608Low27,690.5Close27,927.5
bearish · range 917.5 pts
Projected range · next session271.25 pts28,058.75 – 28,330

Index drivers

Nvidia, the heaviest weight, fell Friday and reports Tuesday after the close, while weekend headlines say its CEO resigned and may return. Broadcom, Tesla, Alphabet and Amazon also slipped. Meta rallied, and Apple and Microsoft edged higher.

Market data as of Nov 15, 6:32 PM EST · Weights as of 2026-09-30

Evidence · 10 cited findings

Price action · weekly / daily / H1

  • Chart read is flat. Friday's daily candle was bearish, with a 1.28x ADR range and a rejection at the 21-day average (28687.14). It closed at 27927.5, 1.06 ADR below that average. Weekly W46 closed bullish (26879.25 to 27927.5) but never took the prior-week high of 28970.75.
  • Reopen is read from the incomplete 18:00 ET bar. It opened at 28059.5, a 132-pt (0.18 ADR) gap up from 27927.5, with a high of 28250 and a last print of 28190. The gap is unfilled. The same-session fill base rate is 55.56% (n=9, unproven, Wilson 26.7-81.1).
  • Hourly: Friday's 09:00-10:00 flush from 28418 to 27828 took price under the hourly 21 average. Price is now just above it (about 28160 against a last print of 28190).
  • Levels: Friday low 27690.5, thesis invalidation 28400, week high 28697.25. Data is stale (latest completed bar is Fri 16:00, age 49.5h). No verified Sunday quotes beyond the forming bar.

Metrics

  • 10-year yield 5.15% (+0.05) on Friday and VIX 19.30 (https://www.cnbc.com/2026/11/12/stock-market-today-live-updates.html). This is a risk backdrop for equities, not a driver of the read.
  • December hike odds are 89.4% for 25bp and 10.6% for 50bp, per Reuters/CME FedWatch (https://www.kitco.com/news/off-the-wire/2026-11-13/rate-hike-bets-keep-gold-track-its-worst-week-four-months). The Fed held at 3.75-4.00% on Oct 28 on a 10-2 vote, with two dissents for a hike.
  • Nasdaq Composite fell 0.91% Friday to 25,136.27 but rose 2.27% on the week. SOX fell 3.4%. Friday quotes: AVGO -4.76%, NVDA -2.01%, META +2.90% (quotes 2026-11-13 21:00Z).
  • No Friday settlement for the MNQ contract itself was verified in research. Contract volume was 1.10x its 30-day average.

Sentiment & current events

  • NVDA reports FQ3 FY27 Tuesday 11/17 at about 4:20 pm ET, with the read at 5 pm ET. Prior guidance was $108.0B +/-2% excluding China data-center revenue (https://investor.nvidia.com/news/press-release-details/2026/NVIDIA-Sets-Conference-read-for-Third-Quarter-Financial-Results). NVDA fell six straight weeks.
  • Anthropic IPO is expected the week of Nov 16 and may pull money from AI heavyweights (https://finance.yahoo.com/markets/stocks/articles/nasdaq-futures-dip-nvidia-tumult-103901600.html). This is the only research item marked eligible.
Sources & evidence dates · 25
  1. NVDA reports FQ3 FY27 on Tue Nov 17. Results come at about 1:20 pm PT (4:20 pm ET) and the read is at 5 pm ET. The quarter ended Oct 25. Prior guidance was $108.0B ±2%, assuming no China data-center compute revenue. Q2 revenue was $96.2B.2026-10-28
  2. Week-ahead US calendar (ET). Mon 11/16: Empire State 8:30, Williams 9:05, Chair Warsh 12:00. Tue 11/17: Musalem 7:30, retail sales, import prices 8:30, industrial production 9:15, Hammack 9:30, Williams 2:25 pm. Wed 11/18: housing starts 8:30, Barr 1:35 pm, FOMC Oct 27-28 minutes 2:00 pm, Kashkari 4:15 pm. Thu 11/19: jobless claims 8:30. Fri 11/20: UMich final sentiment 10:00. Kiplinger and StockTitan agree on these times.2026-11-13
  3. features.financialjuice.com2026-11-13
  4. Fed held at 3.75-4.00% on Oct 28 on a 10-2 vote. Cook and Hammack dissented for a 25bp hike, after the 25bp hike in September. CME FedWatch per Reuters on Nov 13: 89.4% for a 25bp December hike and 10.6% for 50bp, versus 96.2% and 13.8% before the PPI release. The hold probability is therefore about 0%. The claim of 100% odds is not supported. Waller said a 50bp hike 'should be considered' if core CPI was about 0.3% or more, and core came in at 0.3%. October CPI was +0.4% headline and +0.3% core. PPI was +0.3% against 0.4% expected, after an upwardly revised +1.4% in September.2026-11-13
  5. Friday Nov 13 close: S&P 500 7,561.67 (-0.40%, +2.51% on the week). Nasdaq Composite 25,136.27 (-0.91%, +2.27% on the week). Dow 52,347.55. The SOX fell 3.4%, with AMD -8.8% and Broadcom -4.8%. The 10-year yield was 5.15% (+0.05), VIX 19.30, gold 3,886.30, and WTI Dec 88.56. Both indexes snapped a four-week losing streak. Nvidia fell 6 straight weeks.2026-11-13
  6. finance.yahoo.com2026-11-13
  7. eia.gov
  8. Yahoo2026-11-15T21:20:02.000Z
  9. Yahoo2026-11-15T21:12:12.000Z
  10. Yahoo2026-11-15T21:09:40.000Z
  11. Yahoo2026-11-15T19:25:05.000Z
  12. Yahoo2026-11-15T17:41:11.000Z
  13. Yahoo2026-11-15T17:33:00.000Z
  14. Yahoo2026-11-15T17:12:51.000Z
  15. Yahoo2026-11-15T11:50:02.000Z
  16. Yahoo2026-11-15T09:30:02.000Z
  17. Yahoo2026-11-15T18:09:50.000Z
  18. Yahoo2026-11-15T16:30:00.000Z
  19. Yahoo2026-11-15T15:50:39.000Z
  20. Yahoo2026-11-15T13:53:24.000Z
  21. Yahoo2026-11-15T13:06:40.000Z
  22. Yahoo2026-11-15T18:07:57.000Z
  23. Yahoo2026-11-15T19:02:04.000Z
  24. Yahoo2026-11-15T18:05:00.000Z
  25. Yahoo2026-11-15T16:35:02.000Z
ES / MESE-mini / Micro E-mini S&P 500Weekly thesis · INTACT

The Lines in the Sand

7,634.67Friday's rally hit this 21-day average and got slammed.
7,560Friday's close; the Sunday gap usually comes back here.
7,519.25Friday's low; lose it and the floor is gone.

The Trap

Bulls who chase the Sunday gap up get caught when it fills back to 7560, which small-sample history says it often does. Bears who press under 7560 get caught when a stretched market snaps back above the hourly average at 7595.2.

Last price7,560
ADR · 30 sessions112.76 pts
Daily EMA217,634.67REJECT
Reopen gapUP · 17.5 ptsOpen · 0.155 ADR
7,3507,4007,4507,5007,5507,6007,6507,700close 16:00Mon 9:30close 16:00Tue 9:30close 16:00Wed 9:30close 16:00Thu 9:30close 16:00Fri 9:30close 16:00Gap fill · 7,560H1 · EMA21 · ES / MES 7,602.5Yellow: 09:30 open · dashed gray: 16:00 close (ET)

The Read

Bears turned Friday's rally away at the 21-day average at 7634.67 and closed it at 7560 on heavier-than-usual volume. Sunday's reopen gapped up, and bulls pushed price back above the hourly average at 7595.2, putting late Friday shorts on the defensive. The broader trend still leans lower, and that is the risk, but price is stretched below its 21-day average and Friday's drop tends to partly reverse, so the tilt is slight and upward. The tell is the gap: a slide back to 7560 tests that tilt early. Clear 7634.67 and the door opens toward 7674.5; lose 7519.25 and the floor is gone.

Yesterday's daily candle · Fri, Nov 13
Open7,620.75High7,669.25Low7,519.25Close7,560
bearish · range 150 pts
Projected range · next session54.5 pts7,577.5 – 7,632

Index drivers

Nvidia, the largest weight, fell Friday ahead of its Tuesday after-close report, and weekend headlines say its CEO resigned and may return. Chip names did most of the damage, with AMD, Broadcom and Micron also lower. Meta rallied, while Apple, Microsoft and Berkshire edged higher.

Market data as of Nov 15, 6:32 PM EST · Weights as of 2026-10-01

Evidence · 11 cited findings

Price action · weekly / daily / H1

  • Chart read is flat. Friday's daily candle was bearish, with a 1.33x ADR range and a rejection at the 21-day average (7634.67). It closed at 7560, 0.66 ADR below it, on volume 1.22x average. Weekly W46 closed bullish (7371 to 7560), a rebound inside the prior range (7322.25-7746.5).
  • Reopen is read from the incomplete 18:00 bar. It opened at 7577.5, a 17.5-pt (0.155 ADR) gap up from 7560, with a high of 7608.5 and a last print of 7602.5. The gap is unfilled. The same-session fill base rate is 77.78% (n=9, unproven, Wilson 45.3-93.7). That is the strongest contradiction to the no-fill read.
  • Hourly: price is back above the hourly 21 average (7595.2) after Friday's drop from 7646 to 7519.
  • Levels: Friday low 7519.25, thesis invalidation 7635, week high 7674.5. Data is stale (latest completed bar is Fri 16:00).

Metrics

  • S&P 500 closed 7,561.67 (-0.40%, +2.51% on the week) and VIX was 19.30 (https://www.cnbc.com/2026/11/12/stock-market-today-live-updates.html). Both indexes snapped four-week losing streaks.
  • 10-year yield 5.15%. December hike odds are 89.4% for 25bp and 10.6% for 50bp (https://www.kitco.com/news/off-the-wire/2026-11-13/rate-hike-bets-keep-gold-track-its-worst-week-four-months). This is a risk backdrop, not a cause.
  • SPY-weighted names fell Friday: NVDA -2.01%, AMD -8.75%, AVGO -4.76%, MU -2.52%. META rose 2.90% (quotes 2026-11-13 21:00Z).
  • No MES-specific settlement was verified beyond the engine's Friday close of 7560.

Sentiment & current events

  • NVDA reports Tuesday at about 4:20 pm ET. It is about 8.45% of SPY (https://investor.nvidia.com/news/press-release-details/2026/NVIDIA-Sets-Conference-read-for-Third-Quarter-Financial-Results).
  • Anthropic IPO is expected the week of Nov 16 (https://finance.yahoo.com/markets/stocks/articles/nasdaq-futures-dip-nvidia-tumult-103901600.html).
  • Micron is drawing rotation flows from Nvidia holders in a Yahoo headline (https://finnhub.io/api/news?id=5b67914b4c7c9c85a2ed59a646c36677419d4da68ffaf8462eaa6767a04a5e31). It is context only.
Sources & evidence dates · 31
  1. NVDA reports FQ3 FY27 on Tue Nov 17. Results come at about 1:20 pm PT (4:20 pm ET) and the read is at 5 pm ET. The quarter ended Oct 25. Prior guidance was $108.0B ±2%, assuming no China data-center compute revenue. Q2 revenue was $96.2B.2026-10-28
  2. Week-ahead US calendar (ET). Mon 11/16: Empire State 8:30, Williams 9:05, Chair Warsh 12:00. Tue 11/17: Musalem 7:30, retail sales, import prices 8:30, industrial production 9:15, Hammack 9:30, Williams 2:25 pm. Wed 11/18: housing starts 8:30, Barr 1:35 pm, FOMC Oct 27-28 minutes 2:00 pm, Kashkari 4:15 pm. Thu 11/19: jobless claims 8:30. Fri 11/20: UMich final sentiment 10:00. Kiplinger and StockTitan agree on these times.2026-11-13
  3. features.financialjuice.com2026-11-13
  4. Fed held at 3.75-4.00% on Oct 28 on a 10-2 vote. Cook and Hammack dissented for a 25bp hike, after the 25bp hike in September. CME FedWatch per Reuters on Nov 13: 89.4% for a 25bp December hike and 10.6% for 50bp, versus 96.2% and 13.8% before the PPI release. The hold probability is therefore about 0%. The claim of 100% odds is not supported. Waller said a 50bp hike 'should be considered' if core CPI was about 0.3% or more, and core came in at 0.3%. October CPI was +0.4% headline and +0.3% core. PPI was +0.3% against 0.4% expected, after an upwardly revised +1.4% in September.2026-11-13
  5. Friday Nov 13 close: S&P 500 7,561.67 (-0.40%, +2.51% on the week). Nasdaq Composite 25,136.27 (-0.91%, +2.27% on the week). Dow 52,347.55. The SOX fell 3.4%, with AMD -8.8% and Broadcom -4.8%. The 10-year yield was 5.15% (+0.05), VIX 19.30, gold 3,886.30, and WTI Dec 88.56. Both indexes snapped a four-week losing streak. Nvidia fell 6 straight weeks.2026-11-13
  6. finance.yahoo.com2026-11-13
  7. eia.gov
  8. Yahoo2026-11-15T21:20:02.000Z
  9. Yahoo2026-11-15T21:12:12.000Z
  10. Yahoo2026-11-15T21:09:40.000Z
  11. Yahoo2026-11-15T19:25:05.000Z
  12. Yahoo2026-11-15T17:41:11.000Z
  13. Yahoo2026-11-15T17:33:00.000Z
  14. Yahoo2026-11-15T17:12:51.000Z
  15. Yahoo2026-11-15T11:50:02.000Z
  16. Yahoo2026-11-15T09:30:02.000Z
  17. Yahoo2026-11-15T18:09:50.000Z
  18. Yahoo2026-11-15T16:30:00.000Z
  19. Yahoo2026-11-15T15:50:39.000Z
  20. Yahoo2026-11-15T13:53:24.000Z
  21. Yahoo2026-11-15T13:06:40.000Z
  22. Yahoo2026-11-15T18:07:57.000Z
  23. Yahoo2026-11-15T19:02:04.000Z
  24. Yahoo2026-11-15T18:05:00.000Z
  25. Yahoo2026-11-15T16:35:02.000Z
  26. Yahoo2026-11-15T21:07:00.000Z
  27. Yahoo2026-11-15T20:50:02.000Z
  28. Yahoo2026-11-15T17:20:02.000Z
  29. Yahoo2026-11-15T17:59:56.000Z
  30. Yahoo2026-11-14T23:53:00.000Z
  31. Yahoo2026-11-14T23:35:00.000Z
GC / MGCGold / Micro GoldWeekly thesis · INTACT

The Lines in the Sand

3,928Above this ceiling, the bears' weekly case breaks.
3,888.7Old weekly floor, now overhead; reclaiming it makes shorts sweat.
3,856.2This week's low; lose it and the floor is gone.

The Trap

Late shorts who pile in after a brutal week get caught when a stretched market snaps back toward 3888.7. Dip-catchers get caught when the bounce stalls under that old floor and 3856.2 gives way.

Last price3,888
ADR · 30 sessions82.32 pts
Daily EMA214,046.11REJECT
Reopen gapDOWN · -18.6 ptsFilled
3,8503,9003,9504,0004,0504,1004,150close 13:30Mon 8:20close 13:30Tue 8:20close 13:30Wed 8:20close 13:30Thu 8:20close 13:30Fri 8:20close 13:30Prior week high · 4,156Prior week low · 3,888.7H1 · EMA21 · GC / MGC 3,883.2Yellow: 08:20 open · dashed gray: 13:30 close (ET)

The Read

Bears own the week. Gold swept 4156, failed there, and broke below the prior-week low at 3888.7. Friday's doji at 3888 shows the flush catching its breath, and the Sunday gap down has already filled. The chart looks heavy and price sits below its 21-day average, which is the risk, but price is stretched far below that average, the rubber band pulls higher, and that gives a slight upward tilt against high yields and a 19-month-high dollar. Reclaim 3888.7 and 3928 comes into play; lose 3856.2 and the floor is gone.

Yesterday's daily candle · Fri, Nov 13
Open3,882High3,927.2Low3,870.8Close3,888
doji · range 56.4 pts
Projected range · next session38.8 pts3,863.2 – 3,902
Evidence · 11 cited findings

Price action · weekly / daily / H1

  • The chart looks heavy. Weekly W46 closed bearish (4074.6 to 3888). It swept the prior-week high (4156), rejected it and accepted below the prior-week low (3888.7). Hourly closes sit under a falling hourly average (about 3894).
  • Friday's daily was a doji (0.69x ADR) at 3888, 1.92 ADR below the 21-day average (4046.11). That is stretched, and the doji after a heavy selloff says momentum is pausing.
  • Reopen is read from the incomplete 18:00 bar. It opened at 3869.4, an 18.6-pt (0.23 ADR) gap down from 3888, with a high of 3892.2, a low of 3863.2 and a last print of 3883.2. The gap is already filled (touched 3888 area high). The weekly low is 3856.2.
  • Data is stale (latest completed bar is Fri 16:00).

Metrics

  • COMEX gold settled at $3,886.30 on Nov 13 (+$1.00). Front-month was down 4.55% on the week, the largest weekly drop since June 5 (https://www.morningstar.com/news/dow-jones/202611139071/comex-gold-ends-the-week-455-lower-at-387970-data-talk). The weekly figure varies by source and contract (4.5-4.8%).
  • The 10-year yield was 5.15% Friday and the dollar index was at a 19-month high. Both are headwinds for gold (https://www.kitco.com/news/off-the-wire/2026-11-13/rate-hike-bets-keep-gold-track-its-worst-week-four-months).
  • Supplied claims were contradicted: gold is about -0.15% to -0.3% month to date, not -5.4% (https://www.xauusdglobal.com/gold-price-history/2026/11/). The record high is $5,318.40 (Jan 29), about 27% above price, not $5,626.80.
  • Intraday low on Nov 12 was $3,856.70. WGC central-bank data was not re-checked.

Sentiment & current events

  • December hike odds are 89.4% for 25bp and 10.6% for 50bp. Waller said a 50bp hike should be considered if core CPI came in about 0.3% or more, and core was 0.3%. October CPI was +0.4% headline.
  • Wednesday FOMC minutes at 2:00 pm and Chair Warsh on Monday at 12:00 are the main events (https://www.kiplinger.com/investing/economy/this-weeks-economic-calendar).
  • A 10-year yield above 5.28% was framed as the trigger for a break below 3,852. Not re-verified.
Sources & evidence dates · 6
  1. Week-ahead US calendar (ET). Mon 11/16: Empire State 8:30, Williams 9:05, Chair Warsh 12:00. Tue 11/17: Musalem 7:30, retail sales, import prices 8:30, industrial production 9:15, Hammack 9:30, Williams 2:25 pm. Wed 11/18: housing starts 8:30, Barr 1:35 pm, FOMC Oct 27-28 minutes 2:00 pm, Kashkari 4:15 pm. Thu 11/19: jobless claims 8:30. Fri 11/20: UMich final sentiment 10:00. Kiplinger and StockTitan agree on these times.2026-11-13
  2. Fed held at 3.75-4.00% on Oct 28 on a 10-2 vote. Cook and Hammack dissented for a 25bp hike, after the 25bp hike in September. CME FedWatch per Reuters on Nov 13: 89.4% for a 25bp December hike and 10.6% for 50bp, versus 96.2% and 13.8% before the PPI release. The hold probability is therefore about 0%. The claim of 100% odds is not supported. Waller said a 50bp hike 'should be considered' if core CPI was about 0.3% or more, and core came in at 0.3%. October CPI was +0.4% headline and +0.3% core. PPI was +0.3% against 0.4% expected, after an upwardly revised +1.4% in September.2026-11-13
  3. Friday Nov 13 close: S&P 500 7,561.67 (-0.40%, +2.51% on the week). Nasdaq Composite 25,136.27 (-0.91%, +2.27% on the week). Dow 52,347.55. The SOX fell 3.4%, with AMD -8.8% and Broadcom -4.8%. The 10-year yield was 5.15% (+0.05), VIX 19.30, gold 3,886.30, and WTI Dec 88.56. Both indexes snapped a four-week losing streak. Nvidia fell 6 straight weeks.2026-11-13
  4. Gold: COMEX settled at $3,886.30 on Nov 13 (+$1.00) after $3,885.30 on Nov 12 (-2.88%). Morningstar/Dow Jones shows front-month gold at $3,879.70, down 4.55% on the week, the largest weekly drop since the week ending June 5, 2026, and the second-lowest settlement this year. Forbes ME says 4.8% and Kitco says 'more than 4%', so the weekly figure differs by contract and source. Intraday low was $3,856.70 on Nov 12. 10-year yield was 5.10% on Thursday. The dollar index was at a 19-month high.2026-11-13
  5. xauusdglobal.com2026-11-13
  6. eia.gov
CL / MCLWTI Crude Oil / Micro WTI Crude OilWeekly thesis · INTACT

The Lines in the Sand

89.65Top of the hourly box; a clean break ends the stall.
88.15Bottom of the box and Sunday's low so far.
86.61Broken weekly floor; a revisit tests the whole bounce.

The Trap

Shorts who press Sunday's small gap down tend to get caught, because gaps like this almost always fill back to 88.93, usually within the hour. With positioning already short-heavy, a pop through 89.65 can turn into a fast squeeze.

Last price88.93
ADR · 30 sessions3.95 pts
Daily EMA2192.46REJECT
Reopen gapDOWN · -0.27 ptsOpen · 0.068 ADR
848586878889909192close 14:30Mon 9:00close 14:30Tue 9:00close 14:30Wed 9:00close 14:30Thu 9:00close 14:30Fri 9:00close 14:30Gap fill · 88.93Prior week low · 86.61H1 · EMA21 · CL / MCL 88.46Yellow: 09:00 open · dashed gray: 14:30 close (ET)

The Read

Bears broke oil below the prior-week low at 86.61 and tagged 83.88, then bulls dragged it back to an 88.93 close. Now price is boxed between 88.15 and 89.65, and neither side is pushing. The chart is bearish and price sits below its 21-day average, but it is also stretched far below that average with the rubber band pulling higher, so the forces cancel and there is no clean edge. Short-heavy positioning and supply headlines are the fuel for a fast move either way. Break above 89.65 and shorts are offside; lose 88.15 and 86.61 is back in play.

Yesterday's daily candle · Fri, Nov 13
Open88.71High89.65Low87.8Close88.93
doji · range 1.85 pts
Projected range · next session0.8 pts88.15 – 88.95
⚠ Flat / choppy conditions likely
Evidence · 8 cited findings

Price action · weekly / daily / H1

  • Chart read is bearish. Weekly W46 closed bearish (90.82 to 88.93) and took and accepted below the prior-week low of 86.61, with a week low of 83.88. Friday was a doji (0.47x ADR, volume 0.82x average) closing 0.90 ADR below the 21-day average (92.46).
  • Hourly structure is compressed between 88.15 and 89.65 around a flat hourly average (88.55).
  • Reopen is read from the incomplete 18:00 bar. It opened at 88.66, a 0.27 (0.07 ADR) gap down from 88.93, with a low of 88.15 and a last print of 88.46. The gap is unfilled. The same-session fill base rate is 93.02% (n=86, reliable), with a 1h median.
  • Data is stale (latest completed bar is Fri 16:00). No verified Sunday contract quotes beyond the forming bar.

Metrics

  • WTI Dec settled 88.56 on Friday, little changed (https://www.cnbc.com/2026/11/12/stock-market-today-live-updates.html).
  • The COT index was 10/100, stale since Nov 3 (S3). Managed-money length is largely liquidated, which raises squeeze risk.

Sentiment & current events

  • Peace-talk collapse is a named upside counter-scenario. Equity-led risk (Nvidia earnings Tuesday) could spill into broad risk sentiment.
  • Wednesday's FOMC minutes at 2:00 pm are the main macro event (https://www.kiplinger.com/investing/economy/this-weeks-economic-calendar).
Sources & evidence dates · 2
  1. Friday Nov 13 close: S&P 500 7,561.67 (-0.40%, +2.51% on the week). Nasdaq Composite 25,136.27 (-0.91%, +2.27% on the week). Dow 52,347.55. The SOX fell 3.4%, with AMD -8.8% and Broadcom -4.8%. The 10-year yield was 5.15% (+0.05), VIX 19.30, gold 3,886.30, and WTI Dec 88.56. Both indexes snapped a four-week losing streak. Nvidia fell 6 straight weeks.2026-11-13
  2. eia.gov

Free. Always. Futures trading edge in your inbox.

You're in. Watch your inbox.

We do not send junk mail. We do not spam.