Session Prep

Two minutes tonight. A plan tomorrow.
Evening edition · Data as of Thu, Nov 12, 5:00 PM EST · All times Eastern
Deep research

Tonight's one thing

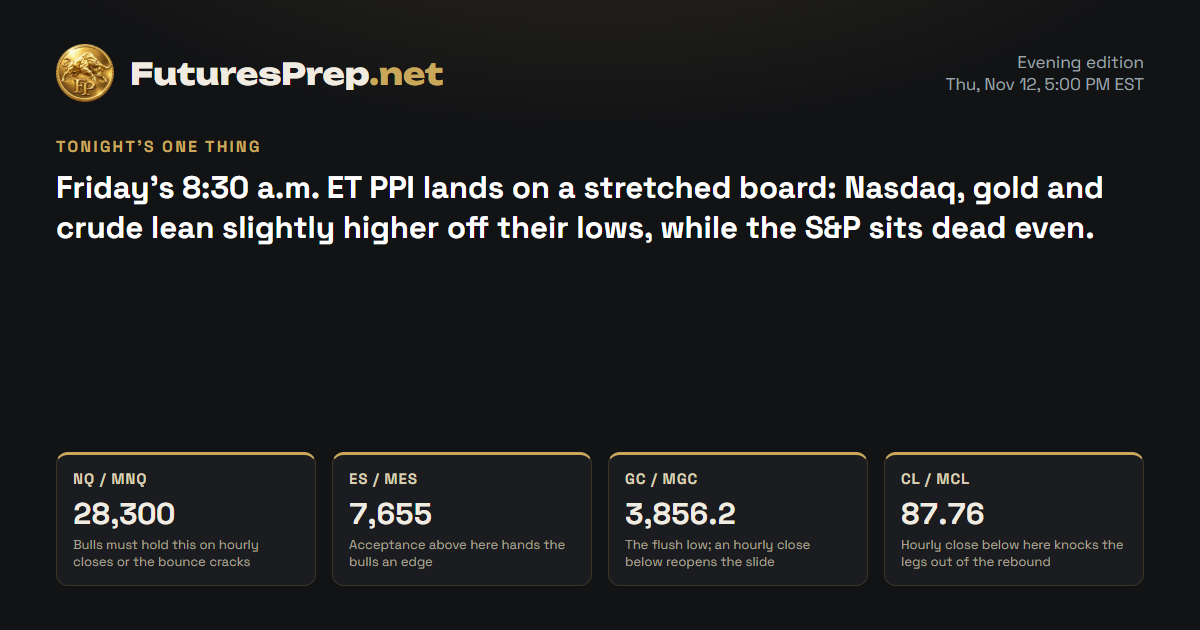
Friday's 8:30 a.m. ET PPI lands on a stretched board: Nasdaq, gold and crude lean slightly higher off their lows, while the S&P sits dead even.

Tomorrow's market movers · Friday, November 13

Time ETImpactEventForecastPrevious
8:30 AMHighCore PPI m/m0.3%0.7%
8:30 AMHighPPI m/m0.4%1.3%

U.S. releases, high and medium impact.

NQ / MNQE-mini / Micro E-mini Nasdaq-100Weekly thesis · INVALIDATED

The Lines in the Sand

28,300Bulls must hold this on hourly closes or the bounce cracks
28,652.5Session high, the first ceiling the rebound has to clear
28,013.75Doji low where bulls stepped in and flipped the day

The Trap

Late bears who pressed the 28013.75 low got squeezed when the day recovered into a doji. The opposite trap sits overhead: bulls chasing straight into the 28764.32 21-day average, the same line that rejected the last push.

Last price28,401.5
ADR · 30 sessions705.5 pts
Daily EMA2128,764.32REJECT
Reopen gapNo opening gap
26,25026,50026,75027,00027,25027,50027,75028,00028,25028,50028,750close 16:00Fri 9:30close 16:00Mon 9:30close 16:00Tue 9:30close 16:00Wed 9:30close 16:00Thu 9:30close 16:00Prior week low · 26,367.25H1 · EMA21 · NQ / MNQ 28,401.5Yellow: 09:30 open · dashed gray: 16:00 close (ET)

The Read

Bulls dragged the Nasdaq off 28013.75 and back to 28401.50, but bears still hold the high ground at the 21-day average near 28764.32. The chart leans higher and price is stretched well below that average, so the rubber band pulls up. That makes the lean slight and higher, not a green light. The risk is plain: price is still under its 21-day average, so the broader trend still points down, and Friday's PPI can hit either side. Hold 28300 and the door opens to 28652.50-28697.25; lose 28300 on an hourly close and the 28013.75 floor comes back into view.

Yesterday's daily candle · Thu, Nov 12
Open28,307.5High28,652.5Low28,013.75Close28,401.5
doji · range 638.75 pts
Projected range · next session455 pts28,235 – 28,690

Index drivers

The heavyweights split hard: Nvidia dropped sharply while Broadcom ripped higher and Alphabet and Tesla gained. Microsoft and Amazon edged up, while Apple and Meta slipped. Nvidia reports earnings next Tuesday after the close.

Market data as of Nov 12, 6:33 PM EST · Weights as of 2026-09-30

Evidence · 7 cited findings

Price action · weekly / daily / H1

  • The chart read leans higher, and price is stretched 0.51 average daily ranges below its 21-day average, creating a second bullish snapback driver.
  • The principal contradiction is that the 28401.50 close remains below the rejecting 21-day average at 28764.32, so the broader trend still leans lower.
  • The daily doji recovered from 28013.75 and H1 stabilized above its intraday EMA21; holding 28300 supports a retest of 28652.50-28697.25, while an hourly close below 28300 would weaken the bullish path.

Metrics

  • The daily range used 90.5% of ADR and volume was 1.119 times its 30-day average, leaving less room for an effortless extension.
  • The last completed H1 range was 81.5 points versus a 105-point expansion threshold, and the market was not expanding at the cutoff.

Sentiment & current events

  • Index-driver performance was divided: NVDA fell 4.3401%, while AVGO rose 5.5443%, GOOGL rose 1.7891% and TSLA rose 1.6912%; this is context rather than a direction driver. https://www.invesco.com/qqq-etf/en/about.html
  • CFTC data through November 3 showed 78,757 non-commercial Micro Nasdaq longs and 55,325 shorts, but the positioning is stale and incomplete as a crowding measure. https://www.cftc.gov/dea/futures/deacmesf.htm
Sources & evidence dates · 24
  1. bls.gov2026-11-03
  2. bls.gov2026-11-10T08:30:00-05:00
  3. federalreserve.gov2026-11-12
  4. iea.org2026-11-03
  5. cftc.gov2026-11-06
  6. cboe.com2026-11-12
  7. Yahoo2026-11-12T21:50:03.000Z
  8. Yahoo2026-11-12T21:50:03.000Z
  9. Yahoo2026-11-12T21:50:02.000Z
  10. Yahoo2026-11-12T21:35:40.000Z
  11. Yahoo2026-11-12T21:23:33.000Z
  12. Yahoo2026-11-12T21:20:49.000Z
  13. Yahoo2026-11-12T21:15:43.000Z
  14. Yahoo2026-11-12T21:11:22.000Z
  15. Yahoo2026-11-12T19:32:12.000Z
  16. Yahoo2026-11-12T21:10:09.000Z
  17. Yahoo2026-11-12T19:50:00.000Z
  18. Yahoo2026-11-12T21:14:43.000Z
  19. Yahoo2026-11-12T20:48:56.000Z
  20. Yahoo2026-11-12T20:07:32.000Z
  21. Yahoo2026-11-12T21:34:55.000Z
  22. Yahoo2026-11-12T21:41:00.000Z
  23. Yahoo2026-11-12T21:35:32.000Z
  24. Yahoo2026-11-12T21:20:04.000Z
ES / MESE-mini / Micro E-mini S&P 500Weekly thesis · INVALIDATED

The Lines in the Sand

7,655Acceptance above here hands the bulls an edge
7,572.5Bottom of the support band; acceptance below hands bears control
7,642.0521-day average capping the tape just overhead

The Trap

The session burned through nearly its whole normal range and still closed nowhere. That is where breakout chasers get caught into the 7642-7655 wall, and breakdown chasers get caught into the 7600-7572.50 floor.

Last price7,621.25
ADR · 30 sessions110.67 pts
Daily EMA217,642.05REJECT
Reopen gapNo opening gap
7,3007,3507,4007,4507,5007,5507,6007,6507,700close 16:00Fri 9:30close 16:00Mon 9:30close 16:00Tue 9:30close 16:00Wed 9:30close 16:00Thu 9:30close 16:00Prior week low · 7,322.25H1 · EMA21 · ES / MES 7,621.25Yellow: 09:30 open · dashed gray: 16:00 close (ET)

The Read

Neither side won the S&P: the day printed a near-neutral doji at 7621.25, with the hourly chart finishing flat against its trend line. Price sits under the 21-day average at 7642.05, which leans lower, but it is only slightly stretched below that line, which pulls back up. Those forces cancel, and there is no clean edge. Big-cap stocks split hard, and Friday's 8:30 a.m. ET PPI is the fuel waiting for a spark. Accept above 7655 and the door opens toward the 7674.5 week high; accept below 7572.50 and the support band is gone.

Yesterday's daily candle · Thu, Nov 12
Open7,616.5High7,674.5Low7,572.5Close7,621.25
doji · range 102 pts
Projected range · next session72 pts7,588 – 7,660
⚠ Flat / choppy conditions likely

Index drivers

Big chip stocks split: Nvidia fell hard while AMD and Broadcom rallied, and both Alphabet share classes rose. Micron and Meta slipped, Apple edged lower, and Microsoft and Amazon edged higher. Nvidia reports earnings next Tuesday after the close.

Market data as of Nov 12, 6:33 PM EST · Weights as of 2026-10-01

Evidence · 6 cited findings

Price action · weekly / daily / H1

  • The chart read is flat: the daily candle was a near-neutral doji and H1 finished almost exactly at its intraday EMA21.
  • Price below the 7642.05 21-day average leans lower, while the 0.19-average-daily-range stretch beneath that average leans back higher; these drivers cancel and leave no clear edge.
  • Near-term resistance is 7642-7655, while 7600-7572.50 is the principal support band.

Metrics

  • The daily session consumed 92.2% of ADR on 1.103 times 30-day average volume without producing a directional close.
  • The last H1 range was 11 points versus an 18.5-point expansion threshold, and the market was not expanding at the cutoff.

Sentiment & current events

  • Large-cap drivers were divided, including NVDA at -4.3401%, AVGO at +5.5443%, GOOGL at +1.7891% and AMD at +5.86%; the dispersion supports uncertainty rather than a directional conclusion. https://www.ssga.com/us/en/intermediary/etfs/state-street-spdr-sp-500-etf-trust-spy
Sources & evidence dates · 28
  1. bls.gov2026-11-03
  2. bls.gov2026-11-10T08:30:00-05:00
  3. federalreserve.gov2026-11-12
  4. iea.org2026-11-03
  5. cboe.com2026-11-12
  6. Yahoo2026-11-12T21:50:03.000Z
  7. Yahoo2026-11-12T21:50:03.000Z
  8. Yahoo2026-11-12T21:50:02.000Z
  9. Yahoo2026-11-12T21:35:40.000Z
  10. Yahoo2026-11-12T21:23:33.000Z
  11. Yahoo2026-11-12T21:20:49.000Z
  12. Yahoo2026-11-12T21:15:43.000Z
  13. Yahoo2026-11-12T21:11:22.000Z
  14. Yahoo2026-11-12T19:32:12.000Z
  15. Yahoo2026-11-12T21:10:09.000Z
  16. Yahoo2026-11-12T19:50:00.000Z
  17. Yahoo2026-11-12T21:14:43.000Z
  18. Yahoo2026-11-12T20:48:56.000Z
  19. Yahoo2026-11-12T20:07:32.000Z
  20. Yahoo2026-11-12T21:34:55.000Z
  21. Yahoo2026-11-12T21:41:00.000Z
  22. Yahoo2026-11-12T21:35:32.000Z
  23. Yahoo2026-11-12T21:20:04.000Z
  24. Yahoo2026-11-12T21:01:00.000Z
  25. Yahoo2026-11-12T20:57:02.000Z
  26. Yahoo2026-11-12T19:44:01.000Z
  27. Yahoo2026-11-12T20:46:51.000Z
  28. SeekingAlpha2026-11-11T23:38:00.000Z
GC / MGCGold / Micro GoldWeekly thesis · INVALIDATED

The Lines in the Sand

3,856.2The flush low; an hourly close below reopens the slide
3,933First real wall any rebound has to punch through
3,888.7Last week's low, broken and now overhead

The Trap

After a flush like this, late bears tend to pile in near the 3856.20 low just as the rubber band is at its tightest. Early bulls get caught too, grabbing the bounce right under 3933 while the hourly trend still points down.

Last price3,881.8
ADR · 30 sessions83.95 pts
Daily EMA214,061.52REJECT
Reopen gapNo opening gap
3,8503,9003,9504,0004,0504,1004,150close 13:30Fri 8:20close 13:30Mon 8:20close 13:30Tue 8:20close 13:30Wed 8:20close 13:30Thu 8:20close 13:30Prior week high · 4,156Prior week low · 3,888.7H1 · EMA21 · GC / MGC 3,881.8Yellow: 08:20 open · dashed gray: 13:30 close (ET)

The Read

Bears hammered gold from 3994.50 down to 3881.80, knocking out last week's low at 3888.70 and leaving 3856.20 as the floor. The chart looks heavy, but price is stretched far below its 21-day average and due to snap back, and a big down day like this tends to partly reverse. That adds up to a slight lean higher, not a rescue. The risk is that price sits well under the 21-day average at 4061.52, so the broader trend still leans lower, and Friday's PPI can jolt rates and gold. Clear 3933 and the snapback has room; an hourly close below 3856.20 and the floor is gone.

Yesterday's daily candle · Thu, Nov 12
Open3,994.5High4,005.9Low3,856.2Close3,881.8
bearish · range 149.7 pts
Projected range · next session83.8 pts3,856.2 – 3,940
Evidence · 6 cited findings

Price action · weekly / daily / H1

  • The chart looks heavy, but price is stretched 2.14 average daily ranges below its 21-day average and is expected to snap back; yesterday's large bearish candle also tends to partly reverse.
  • The strongest contradiction is that price remains below the 4061.52 21-day average, so the broader trend still leans lower.
  • The daily candle fell from 3994.50 to 3881.80 with a 1.78-ADR range, while H1 remained below a declining EMA21; 3856.20 is the downside boundary and 3933 is the first meaningful rebound barrier.

Metrics

  • The session's bearish body measured 112.7 points, volume was 1.3 times its 30-day average and the close was 179.72 points below the daily EMA21.
  • The last H1 range was 6.6 points versus a 23.9-point expansion threshold, with seven bars elapsed since the last expansion.

Sentiment & current events

  • World Gold Council Q3 data showed 321 tonnes of central-bank buying and 211 tonnes of ETF additions; this is older strategic-demand context rather than a short-horizon direction driver. https://www.gold.org/news-and-events/press-releases/central-bank-buying-and-etf-inflows-support-gold-demand-q3
Sources & evidence dates · 7
  1. bls.gov2026-11-03
  2. bls.gov2026-11-10T08:30:00-05:00
  3. federalreserve.gov2026-11-12
  4. home.treasury.gov2026-11-10
  5. World Gold Council Q3 data show central-bank purchases of 321 tonnes, up 42% YoY, and gold-ETF additions of 211 tonnes. These strategic inflows contradict treating the near-term MGC selloff as evidence of a broad collapse in institutional gold demand.2026-11-03
  6. iea.org2026-11-03
  7. cboe.com2026-11-12
CL / MCLWTI Crude Oil / Micro WTI Crude OilWeekly thesis · FULFILLED

The Lines in the Sand

87.76Hourly close below here knocks the legs out of the rebound
91.42Week high, the top of the rebound zone
92.7921-day average still pressing down on the rally

The Trap

Bears who leaned on the crude build got squeezed by the reversal off 85.14. Now the risk flips: bulls chasing the rebound into a day that already used nearly all its normal range, right under the 92.79 21-day average.

Last price88.7
ADR · 30 sessions4.05 pts
Daily EMA2192.79REJECT
Reopen gapNo opening gap
84858687888990919293close 14:30Fri 9:00close 14:30Mon 9:00close 14:30Tue 9:00close 14:30Wed 9:00close 14:30Thu 9:00close 14:30Prior week low · 86.61H1 · EMA21 · CL / MCL 88.7Yellow: 09:00 open · dashed gray: 14:30 close (ET)

The Read

Bulls ripped crude off 85.14 to close at 88.70 in an active reversal day, but the week is still red and the 21-day average at 92.79 looms overhead. Price is stretched well below that average and the chart turned higher, so the slight lean is up. The counter is real: price is still under its 21-day average, the broader trend leans lower, and EIA showed a 4.7-million-barrel crude build. The day used nearly its whole normal range, so easy follow-through is scarce. Hold 88.20-88.60 and the door opens toward 90.00-91.42; an hourly close below 87.76 and the rebound loses its floor.

Yesterday's daily candle · Thu, Nov 12
Open86.49High89.14Low85.14Close88.7
bullish · range 4 pts
Projected range · next session3.23 pts87.82 – 91.05
Evidence · 7 cited findings

Price action · weekly / daily / H1

  • Price is stretched 1.01 average daily ranges below its 21-day average, and the chart read is bullish; together those are the two strongest drivers for continued rebound.
  • The strongest contradiction is that price remains below the rejecting 21-day average at 92.79, so the broader trend still leans lower.
  • The daily candle rallied from 86.49 to 88.70 with a 2.21-point body, while H1 advanced above its rising intraday EMA21; holding 88.20-88.60 supports 90.00-91.42, whereas an hourly close below 87.76 would weaken the rebound.

Metrics

  • The session used 98.9% of ADR and volume was 1.205 times its 30-day average, confirming an active reversal day but leaving less easy range for continuation.
  • The last completed H1 range was 0.49 versus a 0.82 expansion threshold, and the market was not expanding at the cutoff.

Sentiment & current events

  • EIA reported a 4.7-million-barrel commercial crude build to 414.4 million barrels, production at 14.013 million barrels per day, higher imports and lower exports; this is adverse context for the bullish rebound. https://www.eia.gov/petroleum/supply/weekly/
  • The same EIA report showed refinery inputs at 17.047 million barrels per day, while commercial crude inventories remained 3.1% below the year-earlier level. https://www.eia.gov/petroleum/supply/weekly/
Sources & evidence dates · 7
  1. bls.gov2026-11-03
  2. federalreserve.gov2026-11-12
  3. The November 12 EIA report showed commercial crude inventories rising 4.7 million barrels to 414.4 million; domestic production at 14.013 million b/d; imports up 325,000 b/d; exports down 220,000 b/d; refinery inputs at 17.047 million b/d; and total stocks excluding the SPR up 11.4 million barrels. Commercial crude inventories were 3.1% below the year-earlier level.2026-11-12T14:00:00-05:00
  4. EIA's November outlook reports that U.S. commercial crude inventories fell below the 2021-2025 five-year low in October and expects refinery inputs near October's 16.6 million b/d average in November. This tight-inventory evidence contradicts a one-sided bearish interpretation of the weekly crude build.2026-11-10
  5. iea.org2026-11-03
  6. cboe.com2026-11-12
  7. reuters.com2026-11-12T01:52:56Z

Free. Always. Futures trading edge in your inbox.

You're in. Watch your inbox.

We do not send junk mail. We do not spam.