The Lines in the Sand
The Trap
The overnight bounce looks clean, so late longs tend to pile in just under 28608 as the rally runs into Thursday's ceiling and the daily average overhead. When PPI hits, those late longs become the fuel for a fast flush back toward 28243.25.
The Read
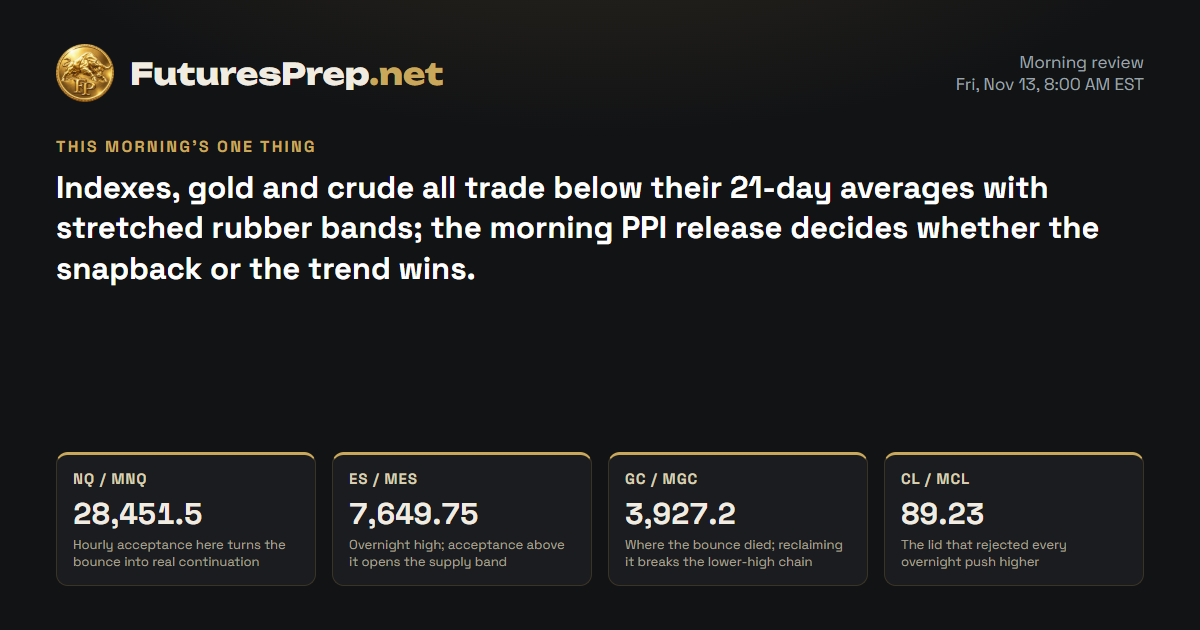
Bulls dragged the Nasdaq off 28013.75 and back to 28401.50, but bears still hold the high ground at the 21-day average near 28764.32. The chart leans higher and price is stretched well below that average, so the rubber band pulls up. That makes the lean slight and higher, not a green light. The risk is plain: price is still under its 21-day average, so the broader trend still points down, and Friday's PPI can hit either side. Hold 28300 and the door opens to 28652.50-28697.25; lose 28300 on an hourly close and the 28013.75 floor comes back into view.
Morning review · Nov 13, 7:30 AM EST
Bulls defended the 28243.25 overnight low and stacked higher hourly closes, but bears still own the daily picture with price capped under the 21-day average at 28764.32. The lean is slightly higher: the hourly chart has turned up, and price is stretched below that 21-day average, a rubber band that tends to snap back. The risk is that the broader trend still points lower, and PPI at the open can flip the script. Hold above 28451.5 and the door opens toward 28608; lose 28243.25 and the floor is gone.
Overnight evidence · 7 cited findings
Overnight price action
- From the prior-evening baseline, price traded as high as 28608, as low as 28243.25 and finished at 28445 for a net gain of 45.5 points.
- The prior path expected 28540 by 06:00; the observed 06:00 close was 28445, leaving the market 95 points below that projection.
- After the 03:00 low, closes recovered from 28264 to 28333.5, 28395.25 and 28445, restoring short-term positive momentum.
Overnight events
- No verified overnight macro result was identified before the 07:30 cutoff.
- PPI remained pending for 08:30 ET and was therefore event risk rather than an observed driver. https://www.bls.gov/ppi/
What changed
- Bullish overnight recovery preserves the evening direction, but the daily EMA rejection and unbroken prior-week high cap conviction.
- Metrics are neutral and macro sentiment opposes; neither layer is allowed to reverse the price-action direction.
Index drivers
| Ticker | Approx. weight | Day move | Next earnings | Top headline |
|---|---|---|---|---|
| NVDA | 8.4% | −4.34% | Nov 17 · After close | Elon Musk Eyes Jensen Huang After Stunning Nvidia Departure |
| MSFT | 5.75% | +0.36% | — | Microsoft Global Outage Enters Second Day as Recovery Efforts Continue |
| AAPL | 7.28% | −0.21% | — | Major streaming services have raised prices by 207% since 2019. Is it still worth it, or is ‘streamflation’ too much? |
| AMZN | 4.04% | +0.48% | — | Major streaming services have raised prices by 207% since 2019. Is it still worth it, or is ‘streamflation’ too much? |
| META | 3.26% | −0.82% | — | State Street Comm Services SPDR (XLC) Adds Meta and Alphabet on Nov. 11 |
| AVGO | 2.47% | +5.54% | — | Michael Burry Sends Stark Warning on Chip Stocks After Huang's exit |
| GOOGL | 3% | +1.79% | — | Social Buzz: Wallstreetbets Stocks Mixed Pre-Bell Friday; Nvidia to Advance, Microsoft to Decline |
| TSLA | 2.81% | +1.69% | — | Elon Musk Eyes Jensen Huang After Stunning Nvidia Departure |
Nvidia dropped hard in the last cash session while Broadcom, Alphabet and Tesla closed higher, leaving the Nasdaq heavyweights pulling in opposite directions. Microsoft headlines are dominated by a global outage now in its second day. Nvidia reports earnings after the close next Tuesday.
Market data as of Nov 13, 7:33 AM EST · Weights as of 2026-09-30
Evidence · 7 cited findings
Price action · weekly / daily / H1
- The chart read leans higher, and price is stretched 0.51 average daily ranges below its 21-day average, creating a second bullish snapback driver.
- The principal contradiction is that the 28401.50 close remains below the rejecting 21-day average at 28764.32, so the broader trend still leans lower.
- The daily doji recovered from 28013.75 and H1 stabilized above its intraday EMA21; holding 28300 supports a retest of 28652.50-28697.25, while an hourly close below 28300 would weaken the bullish path.
Metrics
- The daily range used 90.5% of ADR and volume was 1.119 times its 30-day average, leaving less room for an effortless extension.
- The last completed H1 range was 81.5 points versus a 105-point expansion threshold, and the market was not expanding at the cutoff.
Sentiment & current events
- Index-driver performance was divided: NVDA fell 4.3401%, while AVGO rose 5.5443%, GOOGL rose 1.7891% and TSLA rose 1.6912%; this is context rather than a direction driver. https://www.invesco.com/qqq-etf/en/about.html
- CFTC data through November 3 showed 78,757 non-commercial Micro Nasdaq longs and 55,325 shorts, but the positioning is stale and incomplete as a crowding measure. https://www.cftc.gov/dea/futures/deacmesf.htm
Sources & evidence dates · 26
- bls.gov2026-11-03
- bls.gov2026-11-10T08:30:00-05:00
- federalreserve.gov2026-11-12
- iea.org2026-11-03
- cftc.gov2026-11-06
- cboe.com2026-11-12
- Yahoo2026-11-13T11:52:25.000Z
- Yahoo2026-11-13T11:51:30.000Z
- Yahoo2026-11-13T11:50:00.000Z
- Yahoo2026-11-13T11:47:17.000Z
- Yahoo2026-11-13T11:40:02.000Z
- Yahoo2026-11-13T11:38:49.000Z
- Yahoo2026-11-13T11:45:00.000Z
- Yahoo2026-11-13T11:04:58.000Z
- Yahoo2026-11-13T11:04:52.000Z
- Yahoo2026-11-13T11:04:16.000Z
- Yahoo2026-11-13T11:04:06.000Z
- Yahoo2026-11-13T11:05:01.000Z
- Yahoo2026-11-13T11:01:47.000Z
- ChartMill2026-11-13T09:40:55.000Z
- Yahoo2026-11-13T11:41:11.000Z
- Yahoo2026-11-13T11:37:37.000Z
- Yahoo2026-11-13T11:17:13.000Z
- Yahoo2026-11-13T11:35:27.000Z
- Yahoo2026-11-13T11:19:06.000Z
- Yahoo2026-11-13T11:12:48.000Z