Session Prep

Two minutes tonight. A plan tomorrow.
Morning review · Data as of Thu, Nov 12, 7:00 AM EST · All times Eastern
Deep research

This morning's one thing

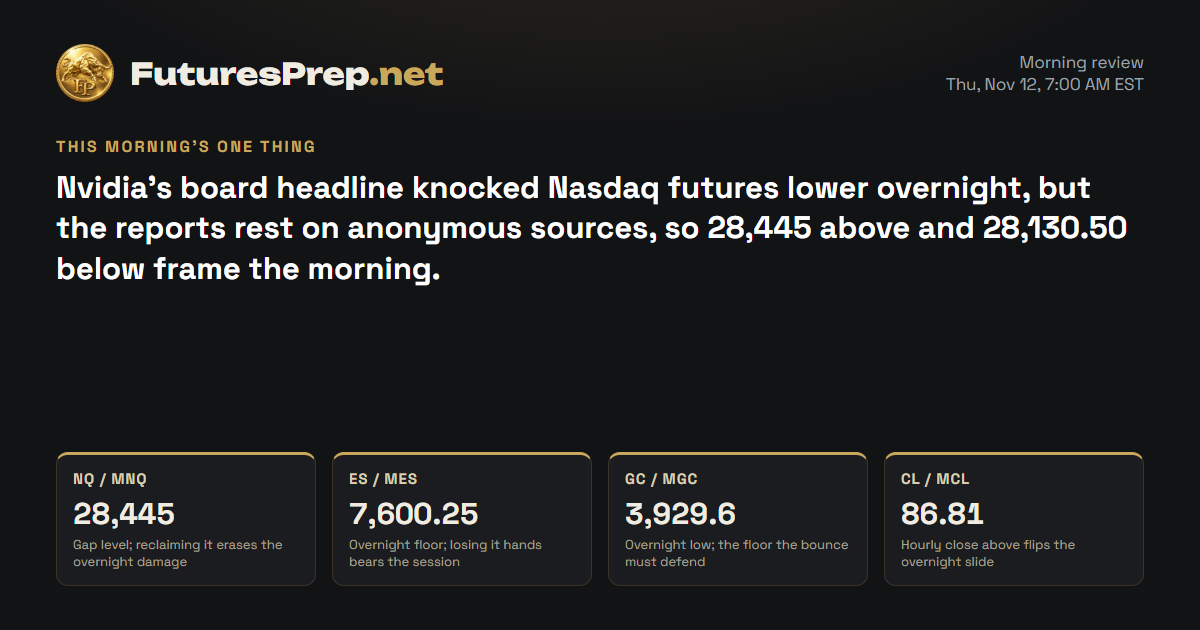
Nvidia's board headline knocked Nasdaq futures lower overnight, but the reports rest on anonymous sources, so 28,445 above and 28,130.50 below frame the morning.

Today's market movers · Thursday, November 12

Time ETImpactEventForecastPrevious
8:30 AMMediumUnemployment Claims194K189K

U.S. releases, high and medium impact.

NQ / MNQE-mini / Micro E-mini Nasdaq-100Weekly thesis · INVALIDATED

The Lines in the Sand

28,445Gap level; reclaiming it erases the overnight damage
28,130.5Overnight floor; a break opens the trapdoor
28,800.621-day average that rejected yesterday's rally

The Trap

Late bears tend to chase the Nvidia headline straight into the 28,130.50 floor, even though the reports are anonymous and other chip names rallied. If that floor holds, the crowd pressing lows is the first group squeezed back toward the gap.

Last price28,225
ADR · 30 sessions704.83 pts
Daily EMA2128,800.6BELOW
Reopen gapDOWN · -137.5 ptsOpen · 0.195 ADR
26,25026,50026,75027,00027,25027,50027,75028,00028,25028,50028,750Thu 9:30close 16:00Fri 9:30close 16:00Mon 9:30close 16:00Tue 9:30close 16:00Wed 9:30close 16:00Gap fill · 28,445Prior week low · 26,367.25H1 · EMA21 · NQ / MNQ 28,225Dashed: last night's path
Overnight: held

The Read

Bears hold the high ground for now: the daily candle was rejected at the 21-day average near 28,800.60, and tonight's session opened at 28,307.50 and slid to 28,130.50. The tilt is lower, but only barely: price is trading below its 21-day average, the hourly and daily chart look heavy, and yesterday's up candle tends to give some of it back. The risk is the stretch, because price has run a long way below that average and the rubber band pulls higher. The strong November 11 tech rebound and fresh Nvidia headlines make this a nervous tape, not a clean one. Lose 28,130.50 on a close and the floor is gone; reclaim 28,445 and the bears are offside.

Morning review · Nov 12, 7:30 AM EST

Bears own the overnight after a gap down on the Nvidia board report, and bulls who bought yesterday's close are offside. Price dropped to 28,130.50, bounced to 28,369, then printed lower highs back to 28,225. The chart looks heavy, with price under its 21-day average and yesterday's up day prone to giving some back, but price is stretched below that average and the rubber band pulls higher. Lose 28,130.50 and the floor is gone; reclaim 28,445 and the gap-down story falls apart.

Overnight evidence · 15 cited findings

Overnight price action

  • Opened 28,307.50 after a 137.50-point gap down from the 28,445 close and printed a 28,369 high in the 21:00 ET hour.
  • The low of 28,130.50 came in the 18:00 ET hour; the 06:00 ET bar closed at 28,225, so net change was -82.50 points.
  • H1 range is compressing at 28,200-28,300 with an H1 EMA21 near 28,269.
  • The 28,445 gap is unfilled and price crossed the weekly thesis invalidation (28,232.25) but not the 28,445 session invalidation.
  • Projected candle: open 28,225, high 28,400, low 28,050, close 28,140.

Overnight events

  • No scheduled high-impact release occurred overnight.
  • The Nvidia board and CEO report arrived off-hours, with Nasdaq futures down about 0.7-1% per CNBC and WSJ.
  • There was no primary confirmation of the board action, and the exact 07:30 ET quotes were not obtained.
  • Foxconn reported a 34% rise in quarterly profit and expects continued AI demand (https://finnhub.io/api/news?id=eb55ae55c0b3df33ac0a0be668bfaefe66527b2695bda960d2681572d6de0258).
  • The Fed pricing figures conflict across sources and are unresolved.

What changed

  • Direction stays bearish with the carried read intact.
  • Metrics modestly oppose: the unfilled gap (unproven 55.56% fill base rate) and a compressing H1 leave rebound capacity.
  • Sentiment supports modestly through the Nvidia-driven futures weakness, but it is a single-name headline of unconfirmed durability.
  • The strongest contradiction is the 28,445 gap.
  • Net: unchanged, conditional on the NY-AM window, with no discretionary override.
Yesterday's daily candle · Wed, Nov 11
Open27,897.25High28,697.25Low27,845.25Close28,445
bullish · range 852 pts
Projected range · next session500 pts27,920 – 28,420

Index drivers

In yesterday's regular session Nvidia, Apple, Alphabet, Tesla and Broadcom closed higher, while Microsoft, Amazon and Meta closed lower. This morning's headlines say techs fell as Nvidia's board weighs ousting CEO Jensen Huang, while AMD and Broadcom jumped on the news. Nvidia reports earnings on November 17 after the close.

Market data as of Nov 12, 7:33 AM EST · Weights as of 2026-09-30

Evidence · 13 cited findings

Price action · weekly / daily / H1

  • Price is below its 28,800.60 21-day average and the hourly/daily chart read is bearish, providing the two strongest reasons for the bearish read.
  • Yesterday's bullish candle tends to partly reverse, adding another bearish driver.
  • The main counter is stretch: price is 0.82 average daily ranges below its 21-day average, creating a meaningful upward rubber-band risk.
  • The completed daily candle rejected the 21-day average, while the forming session opened at 28,307.50 and traded down to 28,130.50.
  • A close below 28,130.50 activates the 09:00-11:00 ET expansion scenario; recovery above 28,445 weakens the immediate bearish path.

Metrics

  • The forming session has used 0.27 ADR, while the last completed hourly range was 106.25 points against a 105-point expansion threshold.
  • The 137.50-point downside gap from 28,445 remains open; its same-session fill sample is 55.56% with only nine observations and is explicitly unproven.
  • The week remains 1,340.75 points above its 26,879.25 open but has not taken the 28,970.75 prior-week high.
  • Driver weights and constituent data are contextual only and do not determine the bearish direction or its conviction.

Sentiment & current events

  • Nasdaq-100 futures rose about 1.9% before the November 11 cash session, a current counterweight to the bearish read (https://www.bnnbloomberg.ca/markets/2026/11/11/us-futures-climb-and-nvidia-shares-stabilize-in-a-brutal-week-for-the-chipmaker/).
  • A secondary report placed the Nasdaq-100 November 11 gain near 2.28%; this contradicts unqualified bearish momentum but does not negate the conditional trigger below 28,130.50 (https://www.marketscreener.com/news/energy-up-as-oil-retreat-pauses-energy-roundup-ce785edbd180ff22).
  • Late supplied headlines reported that Nvidia directors were considering removing CEO Jensen Huang, creating fresh index-specific headline risk (https://finnhub.io/api/news?id=1e793578e568123606a1dba9e23dcb0b7bd1782b4c32c2fe5131b9884b13917d).
  • CFTC positioning is dated November 3 and cannot establish crowding after the November 11 equity rebound (https://www.cftc.gov/MarketReports/CommitmentsofTraders/index.htm).
Sources & evidence dates · 24
  1. bls.gov2026-11-03
  2. bls.gov2026-11-10
  3. bls.gov2026-11-10
  4. Nasdaq-100 futures rose about 1.9% before the November 11 cash session, while S&P 500 futures rose about 0.9%; CoreWeave guidance and a semiconductor rebound were cited catalysts.2026-11-11T08:26:00-05:00
  5. marketscreener.com2026-11-11T17:43:00-05:00
  6. cftc.gov2026-11-06
  7. The Reddit sample is anecdotal S4 evidence and cannot be used as directional confirmation or as proof of aggregate retail positioning.
  8. Yahoo2026-11-12T11:54:32.000Z
  9. Yahoo2026-11-12T11:52:38.000Z
  10. Yahoo2026-11-12T11:51:37.000Z
  11. Yahoo2026-11-12T11:31:28.000Z
  12. Yahoo2026-11-12T11:06:01.000Z
  13. Yahoo2026-11-12T11:05:16.000Z
  14. Yahoo2026-11-12T11:10:58.000Z
  15. Yahoo2026-11-12T11:51:14.000Z
  16. Yahoo2026-11-12T11:31:58.000Z
  17. Yahoo2026-11-12T11:04:45.000Z
  18. Yahoo2026-11-12T11:43:00.000Z
  19. Yahoo2026-11-12T11:32:20.000Z
  20. Yahoo2026-11-12T11:14:55.000Z
  21. Yahoo2026-11-12T11:13:11.000Z
  22. Yahoo2026-11-12T11:42:00.000Z
  23. Yahoo2026-11-12T11:37:32.000Z
  24. Yahoo2026-11-12T11:32:38.000Z
ES / MESE-mini / Micro E-mini S&P 500Weekly thesis · INVALIDATED

The Lines in the Sand

7,600.25Overnight floor; losing it hands bears the session
7,641.75Yesterday's close and the open gap, the upside magnet
7,644.1321-day average that rejected price yesterday

The Trap

A 28.50-point overnight range tempts people to treat every small poke at 7,600.25 or 7,641.75 as the breakout. In a tight box like this, the first push often reverses and catches whoever chased it.

Last price7,608.25
ADR · 30 sessions110.43 pts
Daily EMA217,644.13BELOW
Reopen gapDOWN · -25.25 ptsOpen · 0.229 ADR
7,3007,3507,4007,4507,5007,5507,6007,6507,7007,750Thu 9:30close 16:00Fri 9:30close 16:00Mon 9:30close 16:00Tue 9:30close 16:00Wed 9:30close 16:00Gap fill · 7,641.75Prior week high · 7,746.5Prior week low · 7,322.25H1 · EMA21 · ES / MES 7,608.25Dashed: last night's path

The Read

Bears are defending the 21-day average: the daily candle was rejected there near 7,644.13, and tonight's session opened at 7,616.50 and has stayed pinned below the unfilled gap at 7,641.75. The tilt is lower, but only a touch: price sits below its 21-day average, the hourly and daily chart look heavy, and yesterday's up candle tends to partly reverse. The counterweight is a modest stretch below that average, a smaller rubber band than in the Nasdaq but still pulling higher. A broad chip rally on November 11 is the rebound risk, while late Nvidia headlines add headline risk the other way. Close below 7,600.25 and the floor is gone; accept above 7,641.75 and the bearish case is finished for the session.

Morning review · Nov 12, 7:30 AM EST

Bulls and bears fought to a standstill overnight: the S&P took a lighter hit than the Nasdaq from the Nvidia news and drifted inside a 28.50-point box. Price sits at 7,608.25, just above the 7,600.25 floor and under the 7,641.75 gap. The chart leans slightly heavy, below its 21-day average after yesterday's rally was rejected there, though price is only a little stretched and could snap back. Close below 7,600.25 and the floor gives way; get accepted above 7,641.75 and the door opens higher.

Overnight evidence · 15 cited findings

Overnight price action

  • Opened 7,616.50 after a 25.25-point gap down from the 7,641.75 close.
  • The range was 7,600.25-7,628.75 and the 06:00 ET bar closed at 7,608.25 (net -8.25).
  • The latest H1 range of 9.75 is well below the 18.50 expansion threshold and the H1 EMA21 is flat near 7,612.
  • The 7,641.75 gap is unfilled and the weekly thesis invalidation (7,557.75) was crossed earlier in the week.
  • Projected candle: open 7,608, high 7,638, low 7,585, close 7,617.

Overnight events

  • No scheduled high-impact release occurred overnight.
  • The Nvidia board and CEO report arrived off-hours, with S&P futures about 0.4% lower per supplied CNBC data.
  • No primary confirmation of the Nvidia board action exists, and exact 07:30 ET quotes were not obtained.
  • Foxconn's quarterly profit rose 34% and it expects continued AI demand (https://finnhub.io/api/news?id=eb55ae55c0b3df33ac0a0be668bfaefe66527b2695bda960d2681572d6de0258).
  • Fed pricing sources conflict and the figure is unresolved.

What changed

  • The direction is flat because the prior bearish read found no follow-through.
  • Metrics are neutral: a high but unproven gap fill rate offsets a non-expanding H1.
  • Sentiment is neutral: Nvidia downside skew versus fearful, contrarian-supportive positioning.
  • The strongest contradiction is the prior bearish projection against a 28.50-point flat range.
  • Net: adjusted, with no discretionary override.
Yesterday's daily candle · Wed, Nov 11
Open7,555High7,671.5Low7,547.5Close7,641.75
bullish · range 124 pts
Projected range · next session84 pts7,560 – 7,644

Index drivers

In yesterday's regular session Nvidia, Apple, Alphabet, Tesla, Broadcom and Berkshire closed higher, with Micron and AMD posting big gains, while Microsoft, Amazon and Meta closed lower. This morning's headlines say techs fell as Nvidia's board weighs ousting CEO Jensen Huang, while AMD and Broadcom jumped. Nvidia reports earnings on November 17 after the close.

Market data as of Nov 12, 7:33 AM EST · Weights as of 2026-10-01

Evidence · 14 cited findings

Price action · weekly / daily / H1

  • Price is below its 7,644.13 21-day average and the hourly/daily chart read is bearish, providing the two strongest reasons for the bearish read.
  • Yesterday's bullish candle tends to partly reverse, adding another bearish driver.
  • The main counter is that price is 0.34 average daily ranges below its 21-day average, creating a smaller upward rubber-band pull.
  • The completed daily candle rejected the 21-day average; the forming session opened at 7,616.50 and remained below the unfilled 7,641.75 gap.
  • A close below 7,600.25 activates the 09:00-11:00 ET expansion scenario; acceptance above 7,641.75 negates the immediate bearish path.

Metrics

  • The forming session has used 0.25 ADR; the latest 14.50-point hourly range is below the 18.50-point expansion threshold.
  • The 25.25-point downside gap has an unproven 77.78% same-session fill rate from only nine observations.
  • The week remains 235.75 points above its 7,371.00 open but below the 7,746.50 prior-week high.
  • Supplied heavyweight quotes were mixed, including NVDA +2.87%, AAPL +2.04%, AVGO +3.99%, MSFT -2.26%, AMZN -1.74%, and META -1.97%.
  • Metrics are contextual and do not determine the bearish direction or conviction.

Sentiment & current events

  • The November 11 technology rebound provides positive cross-index context against the bearish read (https://www.bnnbloomberg.ca/markets/2026/11/11/us-futures-climb-and-nvidia-shares-stabilize-in-a-brutal-week-for-the-chipmaker/).
  • Strong gains in supplied semiconductor quotes, including MU +11.89% and AMD +7.32%, are a rebound risk rather than a directional cause.
  • Late Nvidia governance headlines create fresh downside headline risk for a major index constituent (https://finnhub.io/api/news?id=2411578ee09832557fc1387c6f2181677be979b7b64e1ced2e6a1e0e00fa567c).
  • Current positioning is UNKNOWN because cited CFTC data predates the latest equity rebound (https://www.cftc.gov/MarketReports/CommitmentsofTraders/index.htm).
Sources & evidence dates · 31
  1. bls.gov2026-11-03
  2. bls.gov2026-11-10
  3. bls.gov2026-11-10
  4. Nasdaq-100 futures rose about 1.9% before the November 11 cash session, while S&P 500 futures rose about 0.9%; CoreWeave guidance and a semiconductor rebound were cited catalysts.2026-11-11T08:26:00-05:00
  5. cftc.gov2026-11-06
  6. The Reddit sample is anecdotal S4 evidence and cannot be used as directional confirmation or as proof of aggregate retail positioning.
  7. Yahoo2026-11-12T11:54:32.000Z
  8. Yahoo2026-11-12T11:52:38.000Z
  9. Yahoo2026-11-12T11:51:37.000Z
  10. Yahoo2026-11-12T11:31:28.000Z
  11. Yahoo2026-11-12T11:06:01.000Z
  12. Yahoo2026-11-12T11:05:16.000Z
  13. Yahoo2026-11-12T11:10:58.000Z
  14. Yahoo2026-11-12T11:51:14.000Z
  15. Yahoo2026-11-12T11:31:58.000Z
  16. Yahoo2026-11-12T11:04:45.000Z
  17. Yahoo2026-11-12T11:43:00.000Z
  18. Yahoo2026-11-12T11:32:20.000Z
  19. Yahoo2026-11-12T11:14:55.000Z
  20. Yahoo2026-11-12T11:13:11.000Z
  21. Yahoo2026-11-12T11:42:00.000Z
  22. Yahoo2026-11-12T11:37:32.000Z
  23. Yahoo2026-11-12T11:32:38.000Z
  24. Yahoo2026-11-12T11:50:00.000Z
  25. Yahoo2026-11-12T11:33:13.000Z
  26. Yahoo2026-11-12T12:02:22.000Z
  27. Yahoo2026-11-12T12:02:21.000Z
  28. Yahoo2026-11-12T12:02:21.000Z
  29. SeekingAlpha2026-11-11T23:38:00.000Z
  30. Yahoo2026-11-11T21:03:55.000Z
  31. Yahoo2026-11-11T20:33:00.000Z
GC / MGCGold / Micro GoldWeekly thesis · INVALIDATED

The Lines in the Sand

3,929.6Overnight low; the floor the bounce must defend
3,985Hourly lid; a close above flips the heavy picture
3,888.7Prior-week low, the next floor if this one cracks

The Trap

After two straight down days, the crowd tends to pile onto the short side right at the 3,929.60 low, after the move has already run most of its normal daily range. A short-covering pop toward 3,985 is how those late bears get squeezed.

Last price3,949.5
ADR · 30 sessions80.74 pts
Daily EMA214,079.49BELOW
Reopen gapNo opening gap
3,9253,9503,9754,0004,0254,0504,0754,1004,1254,1504,175Thu 8:20close 13:30Fri 8:20close 13:30Mon 8:20close 13:30Tue 8:20close 13:30Wed 8:20close 13:30Prior week high · 4,156H1 · EMA21 · GC / MGC 3,949.5Dashed: last night's path
Overnight: invalidated

The Read

INVALIDATED

Bulls got run over this week: gold swept the 4,156.00 prior-week high at 4,158.70, failed to hold it, and has carved lower highs and lower lows ever since. The chart looks heavy, but price is stretched well below its 21-day average and yesterday's down candle tends to partly reverse, so the tilt is toward a modest snapback higher. The tell is the latest hourly bar, which bounced hard off 3,973.60. The risk is the bigger trend, because price is still under its 21-day average and gold fell on November 11. Close above 4,021.70 and the door opens; lose 3,973.60 and the floor is gone.

Morning review · Nov 12, 7:30 AM EST

Bears have controlled gold for two sessions, and bulls who trusted this week's sweep of the prior-week high are offside. Price slid from 3,994.50 to a 3,929.60 low, managed only a weak bounce to 3,959.20, and sits at 3,949.50. The chart looks heavy and the broader trend still points lower, but price is badly stretched below its 21-day average and yesterday's drop tends to partly reverse, which tilts slightly toward a snapback. Hold 3,929.60 and close above 3,985 and the door opens; lose 3,929.60 and 3,888.70 is the next floor.

Overnight evidence · 15 cited findings

Overnight price action

  • Opened 3,994.50 and drifted lower; the 03:00 ET bar fell from 3,970.30 to 3,933.80 and the low of 3,929.60 printed in the 04:00 ET hour.
  • High was 4,005.90 and the 06:00 ET bar closed at 3,949.50 (net -45.00).
  • A bounce to 3,959.20 faded into 3,949.50, a weak lower-high bounce below the H1 EMA21.
  • The prior 3,973.60 invalidation was crossed and the H1 close remains below it.
  • Projected candle: open 3,949.50, high 3,964, low 3,895, close 3,915.

Overnight events

  • No scheduled high-impact US release occurred overnight.
  • Gold fell below 4,000 for a third straight session per Kitco (https://www.kitco.com/charts/gold).
  • The Fed hike repricing narrative and dollar strength are supplied drivers; the exact probabilities are UNKNOWN.
  • No exact premarket MGC quote was obtained at 07:30 ET; only the Kitco 06:58 ET spot quote is timestamped.
  • Gold Council, positioning and real-yield data were not rechecked in this pass.

What changed

  • The direction is bearish after the prior bullish snapback failed.
  • Metrics are neutral: the 0.945 ADR move raises exhaustion risk while the weekly structure is bearish.
  • Sentiment supports modestly through the Kitco and Trading Economics quotes and the hawkish rates narrative, with unresolved figures.
  • The strongest contradiction is the near-full ADR already used overnight.
  • Net: INVALIDATED last night's read, with no discretionary override.
Yesterday's daily candle · Wed, Nov 11
Open4,043.4High4,074.8Low3,989.4Close3,994.2
bearish · range 85.4 pts
Projected range · next session80 pts3,970 – 4,050
Evidence · 14 cited findings

Price action · weekly / daily / H1

  • Price is stretched 0.99 average daily ranges below its 21-day average, and yesterday's bearish candle tends to partly reverse; those are the two bullish drivers.
  • The chart looks heavy, but the stretch and expected partial reversal carry the read toward a snapback rather than continuation lower.
  • The strongest counter is that price remains below its 4,079.49 21-day average, so the broader trend still leans lower.
  • The hourly chart has lower highs and lower lows from 4,158.70, but the latest expanding bar rebounded from 3,973.60.
  • A close above the 4,021.70 hourly EMA area activates the 08:00-10:00 ET bullish expansion scenario.

Metrics

  • The forming session has used 0.34 ADR; the latest 27.30-point hourly range exceeded the 23.90-point expansion threshold.
  • The week swept the 4,156.00 prior-week high at 4,158.70 but failed to accept above it.
  • Price is 79.79 points below the daily 21-day average, equivalent to 0.99 ADR.
  • No current session gap is present; older open gaps at 4,320.70 and 3,884.40 are not immediate overnight fill forecasts.
  • Metrics provide context only and do not cause the bullish direction or conviction.

Sentiment & current events

  • Gold futures were reported down about 1% near 3,990 on November 11, opposing the bullish snapback read (https://www.investopedia.com/stock-market-today-dow-jones-s-and-p-500-nasdaq-11112026-12248789).
  • Structural central-bank and ETF demand conflicts with immediate bearish context but was not fully reverified and cannot determine the overnight direction.
  • The BLS schedule verifies November 13 PPI, outside this overnight resolution, and does not verify the other supplied calendar claims (https://www.bls.gov/schedule/2026/11_sched_list.htm).
  • Current positioning is UNKNOWN because cited CFTC data is dated November 3 (https://www.cftc.gov/MarketReports/CommitmentsofTraders/index.htm).
Sources & evidence dates · 7
  1. bls.gov2026-11-03
  2. bls.gov2026-11-10
  3. bls.gov2026-11-10
  4. investopedia.com2026-11-11T16:18:00-05:00
  5. atfx.com2026-11-11
  6. cftc.gov2026-11-06
  7. The Reddit sample is anecdotal S4 evidence and cannot be used as directional confirmation or as proof of aggregate retail positioning.
CL / MCLWTI Crude Oil / Micro WTI Crude OilWeekly thesis · FULFILLED

The Lines in the Sand

86.81Hourly close above flips the overnight slide
85.2Overnight low that has held so far
83.88Weekly low, the obvious bounce zone below

The Trap

After a week of steady losses, latecomers tend to press crude lower just as it reaches the 83.88-84.40 weekly-low zone, which commentary already read oversold. The noon EIA report can whip price either way and catch whoever leaned too hard.

Last price85.88
ADR · 30 sessions4.07 pts
Daily EMA2193.2BELOW
Reopen gapNo opening gap
84858687888990919293Thu 9:00close 14:30Fri 9:00close 14:30Mon 9:00close 14:30Tue 9:00close 14:30Wed 9:00close 14:30Prior week low · 86.61H1 · EMA21 · CL / MCL 85.88Dashed: last night's path
Overnight: invalidated

The Read

INVALIDATED

Bears own the week: crude broke from 90.82, accepted below the 86.61 prior-week low, and printed 83.88 before steadying. The chart looks heavy, but price is stretched extremely far below its 21-day average, and that rubber band pulls higher, which tips the scale slightly toward a bounce. The risk is the broader trend, with price still well under the 93.20 average and a reported API draw corrected to a build. December WTI settled at 86.53 on November 11, a small up day, and the session is quiet so far. Close above 86.81 and the door opens; close below 85.79 and the floor is gone.

Morning review · Nov 12, 7:30 AM EST

Bears have dominated crude all week, pushing it below the 86.61 prior-week low, and bulls hoping for a rebound have been offside. Overnight, price faded from 87.53 to 85.88 while the 85.20 low held. The trend still points lower, but price is stretched far below its 21-day average and that rubber band tilts slightly toward a bounce. An hourly close above 86.81 opens the door; lose 85.20 and the 83.88 weekly low comes into play, with EIA inventory data at 12:00 ET as the wild card.

Overnight evidence · 14 cited findings

Overnight price action

  • Opened 86.49 and was last at 85.88, a net change of -0.61.
  • The range was 85.20-87.53; the 87.53 high came in the 03:00 ET bar and faded to 85.80 by 05:00 ET.
  • The 85.20 low came in the 23:00 ET hour and held; the 06:00 ET bar closed at 85.88.
  • H1 EMA21 is near 86.27, with price just below it.
  • Projected candle: open 85.88, high 86.50, low 84.30, close 84.90.

Overnight events

  • No scheduled high-impact release occurred overnight.
  • The EIA report for the week ending Nov 6 is due at 12:00 ET and EIA consensus is UNKNOWN.
  • No exact 07:30 ET quote was obtained for MCL or WTI.
  • The corrected API build, rather than a draw, is secondary-source context.

What changed

  • The direction is bearish after the prior bullish snapback failed.
  • Metrics are neutral: price is 0.573 ADR into the range with a fulfilled weekly thesis, but H1 is not expanding.
  • Sentiment is neutral: the API build and talk hopes lean bearish, offset by low inventories and an oversold tape.
  • The strongest contradiction is the oversold stretch near the 83.88 weekly low.
  • Net: INVALIDATED last night's read, with no discretionary override.
Yesterday's daily candle · Wed, Nov 11
Open86.4High88.73Low85.79Close86.42
doji · range 2.94 pts
Projected range · next session2.5 pts85.7 – 88.2
Evidence · 15 cited findings

Price action · weekly / daily / H1

  • Price is stretched 1.78 average daily ranges below its 21-day average, and that extreme stretch is the bullish driver.
  • The chart looks heavy, but the stretch carries the read toward a snapback rather than another immediate downside story.
  • The strongest counter is that price remains below its 93.20 21-day average, so the broader trend still leans lower.
  • Yesterday was a doji, so the prior-day candle supplies no directional push.
  • A close above 86.81 activates the 08:00-11:00 ET bullish expansion scenario; failure beneath 85.79 preserves downside risk.

Metrics

  • The forming session has used only 0.15 ADR, and the latest 0.40 hourly range is below the 0.82 expansion threshold.
  • The week accepted below the 86.61 prior-week low and remains 4.87 points below its 90.82 open.
  • Price is 7.25 points below its daily 21-day average, equivalent to 1.78 ADR.
  • No current-session gap is present; the older 102.97 open gap is not an immediate fill forecast.
  • Metrics are contextual and do not cause the bullish direction or conviction.

Sentiment & current events

  • December WTI settled November 11 at 86.53, up 0.49 or 0.6%, offering short-term rebound context while remaining compatible with the broader weak structure (https://www.marketscreener.com/news/energy-up-as-oil-retreat-pauses-energy-roundup-ce785edbd180ff22).
  • The initially circulated API 9.8-million-barrel draw was reportedly corrected to an approximately 9-million-barrel build, opposing the bullish snapback context (https://news.marketflux.io/news/api-crude-inventory-report-shows-large-build-after-initial-draw-cb4535473e1de4b56bf4a5f576609d80.html).
  • EIA said end-October commercial crude inventories were near 410 million barrels, the lowest end-October level since 2014, but this is slower-moving context (https://www.eia.gov/outlooks/steo/pdf/steo_text.pdf).
  • The forthcoming EIA report for the week ended November 6 had not superseded the corrected API estimate at the cutoff.
  • Fast-moving Hormuz, Iran-truce, and Russia-Ukraine claims were not freshly verified and are excluded as active catalysts.
Sources & evidence dates · 7
  1. bls.gov2026-11-03
  2. EIA reported commercial crude inventories of 409.8 million barrels for the week ended October 30, down 0.9 million week over week and 11.4 million year over year. Four-week refinery inputs averaged 16.629 mb/d with 93.6% utilization.2026-11-04
  3. EIA's November STEO said commercial crude inventories ended October near 410 million barrels, their lowest end-October level since 2014, as the Brent-WTI spread encouraged exports and reduced imports.2026-11-10
  4. The initially circulated API estimate of a 9.8-million-barrel crude draw was corrected to an approximately 9-million-barrel build. Therefore, the sentiment finding that treats the 9.8-million-barrel draw as an active upside risk is contradicted.2026-11-10
  5. December WTI settled November 11 at $86.53, up $0.49 or 0.6%. This short-term rebound contradicts immediate downside continuation but remains compatible with the broader supplied bearish structure because WTI was still reported down about 17% for November.2026-11-11T17:43:00-05:00
  6. cftc.gov2026-11-06
  7. The Reddit sample is anecdotal S4 evidence and cannot be used as directional confirmation or as proof of aggregate retail positioning.

Free. Always. Futures trading edge in your inbox.

You're in. Watch your inbox.

We do not send junk mail. We do not spam.