Session Prep

Two minutes tonight. A plan tomorrow.
Evening edition · Data as of Tue, Nov 10, 5:00 PM EST · All times Eastern
Deep research

Tonight's one thing

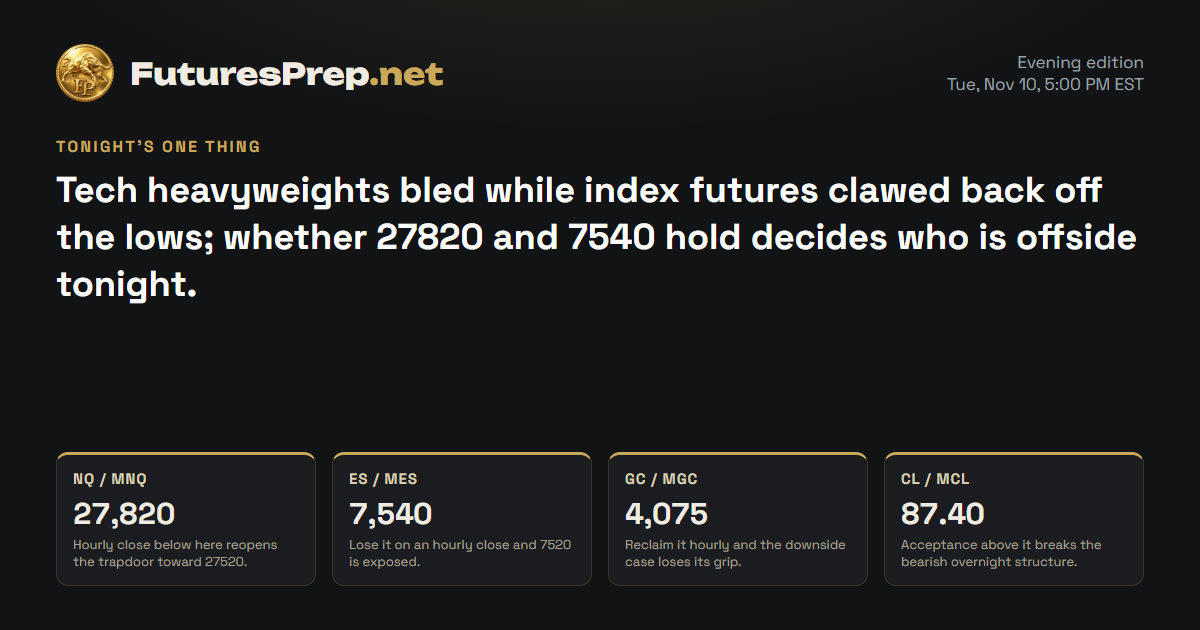
Tech heavyweights bled while index futures clawed back off the lows; whether 27820 and 7540 hold decides who is offside tonight.

Tomorrow's market movers · Wednesday, November 11

No major U.S. releases or tracked driver earnings scheduled.

U.S. releases, high and medium impact.

NQ / MNQE-mini / Micro E-mini Nasdaq-100Weekly thesis · STRESSED

The Lines in the Sand

27,820Hourly close below here reopens the trapdoor toward 27520.
28,129.25Weekly ceiling; bulls need to crack it to keep climbing.
27,517.5Session flush low where dip bulls absorbed the selling.

The Trap

The bounce off 27517.50 looks like strength, so late bulls tend to crowd in just under 28129.25 while NVDA and MSFT stay heavy. Shorts pressing a low that already got absorbed can get caught too.

Last price27,902.25
ADR · 30 sessions689.58 pts
Daily EMA2128,837.45REJECT
Reopen gapNo opening gap
26,50027,00027,50028,00028,50029,000close 16:00Wed 9:30close 16:00Thu 9:30close 16:00Fri 9:30close 16:00Mon 9:30close 16:00Tue 9:30close 16:00Prior week high · 28,970.75Prior week low · 26,367.25H1 · EMA21 · NQ / MNQ 27,902.25Yellow: 09:30 open · dashed gray: 16:00 close (ET)

The Read

Bulls defended the dip, but bears own the mega-cap tape. Price flushed to 27517.50, then clawed back to 27902.25 and closed the hour above its rising 27814.38 average. NVDA and MSFT dragged all day, a hot CPI print adds a rate headwind, and the daily bar still rejected well under 28837.45. That is a tug of war, not an edge. Hold 27820 and the door opens toward 28000-28130; an hourly close below 27820 puts 27680 and 27520 back in play.

Yesterday's daily candle · Tue, Nov 10
Open28,062.25High28,106.5Low27,517.5Close27,902.25
bearish · range 589 pts
Projected range · next session475 pts27,735 – 28,210

Index drivers

NVIDIA led the heavyweights lower, with Microsoft and Apple also down and Alphabet slipping. Amazon, Broadcom and Tesla finished higher while Meta was flat. NVIDIA's earnings land November 17 after the close.

Market data as of Nov 10, 6:33 PM EST · Weights as of 2026-09-30

Evidence · 8 cited findings

Price action · weekly / daily / H1

  • Weekly structure is constructive: price is 1023 points above the weekly open after rebounding from 26737.25, although 28129.25 caps the current advance and the prior-week high remains untaken.
  • Daily structure is conflicted: the bearish candle rejected below the 28837.45 EMA21, but its small body and recovery from 27517.50 show absorption rather than decisive continuation lower.
  • H1 recovered above its rising 27814.38 EMA21 into the close; holding 27820 favors an overnight test of 28000-28130, while an H1 close below 27820 would reopen 27680-27520.

Metrics

  • The completed daily range was 589 points, 0.854 ADR, with a 27.16% bearish body and volume at 1.153 times the 30-day average.
  • The final completed H1 bar closed at 27902.25 above its 27814.38 EMA21, but its 87.75-point range remained below the 105-point expansion threshold.
  • Major QQQ drivers were mixed but net adverse: NVDA fell 5.47%, MSFT 2.20% and AAPL 0.62%, while AMZN gained 1.48% and AVGO 3.91%; weights and quotes are supplemental proxy evidence from https://www.invesco.com/qqq-etf/en/about.html.

Sentiment & current events

  • Russia-Ukraine talks were described as constructive and were expected to continue November 11, modestly reducing geopolitical risk without determining the equity path: https://www.pbs.org/newshour/world/russia-and-ukraine-hold-nearly-4-hours-of-u-s-mediated-talks-in-abu-dhabi.
  • The strongest contradiction is the weak mega-cap tape, led by NVDA and MSFT, against the bullish H1 recovery.
Sources & evidence dates · 28
  1. bls.gov2026-11-10
  2. bls.gov2026-11-06
  3. Russia and Ukraine completed nearly four hours of U.S.-mediated talks in Abu Dhabi; U.S. and Ukrainian officials characterized the session as productive or constructive, with negotiations expected to continue November 11.2026-11-10T13:09:00-05:00
  4. reuters.com2026-11-07T13:36:00Z
  5. cmegroup.com2026-11-10
  6. cnbc.com2026-11-10
  7. Yahoo2026-11-10T21:49:09.000Z
  8. Yahoo2026-11-10T21:45:21.000Z
  9. Yahoo2026-11-10T21:44:59.000Z
  10. Yahoo2026-11-10T21:49:05.000Z
  11. Yahoo2026-11-10T21:43:00.000Z
  12. Yahoo2026-11-10T21:38:17.000Z
  13. Yahoo2026-11-10T20:31:51.000Z
  14. Yahoo2026-11-10T20:07:56.000Z
  15. Yahoo2026-11-10T20:02:00.000Z
  16. Yahoo2026-11-10T21:30:57.000Z
  17. Yahoo2026-11-10T21:22:00.000Z
  18. Yahoo2026-11-10T21:55:28.000Z
  19. Yahoo2026-11-10T21:30:00.000Z
  20. Yahoo2026-11-10T19:41:42.000Z
  21. Yahoo2026-11-10T19:39:27.000Z
  22. Yahoo2026-11-10T19:33:00.000Z
  23. Yahoo2026-11-10T21:26:53.000Z
  24. Yahoo2026-11-10T21:18:42.000Z
  25. Yahoo2026-11-10T20:09:43.000Z
  26. Yahoo2026-11-10T19:30:06.000Z
  27. Yahoo2026-11-10T18:46:26.000Z
ES / MESE-mini / Micro E-mini S&P 500Weekly thesis · STRESSED

The Lines in the Sand

7,540Lose it on an hourly close and 7520 is exposed.
7,601.25Weekly high capping the rebound so far.
7,493Session low where the late selling ran out of gas.

The Trap

A four-hour recovery can feel like a fresh trend, and late bulls tend to pile in near 7598-7601, right into weekly resistance. Bears leaning on the daily rejection get squeezed if the hourly holds above its average.

Last price7,555
ADR · 30 sessions108.86 pts
Daily EMA217,644.48REJECT
Reopen gapNo opening gap
7,3007,3507,4007,4507,5007,5507,6007,6507,7007,750close 16:00Wed 9:30close 16:00Thu 9:30close 16:00Fri 9:30close 16:00Mon 9:30close 16:00Tue 9:30close 16:00Prior week high · 7,746.5Prior week low · 7,322.25H1 · EMA21 · ES / MES 7,555Yellow: 09:30 open · dashed gray: 16:00 close (ET)

The Read

Bulls rescued the day from 7493, but bears still hold the ceiling. Price bounced back to 7555 and closed the hour above its 7544.15 average. The daily bar rejected under 7644.48, though, and the two biggest names, NVDA and MSFT, weighed on the tape after a hot CPI print. AMZN, AVGO and Berkshire gains keep this from being a clean risk-off day, so the board stays mixed. Accept above 7560 and 7598-7601 is in reach; lose 7540 and 7520, then 7493, are exposed.

Yesterday's daily candle · Tue, Nov 10
Open7,580.75High7,598.75Low7,493Close7,555
bearish · range 105.75 pts
Projected range · next session92 pts7,528 – 7,620

Index drivers

NVIDIA and Microsoft, the two largest listed names, both fell, with Apple, Alphabet and Micron also lower. Amazon, Broadcom, AMD, Berkshire and Tesla finished higher while Meta was flat. NVIDIA's earnings land November 17 after the close.

Market data as of Nov 10, 6:33 PM EST · Weights as of 2026-10-01

Evidence · 8 cited findings

Price action · weekly / daily / H1

  • Weekly price remains 184 points above its open after defending 7360.75, preserving a green candle despite resistance at 7601.25 and the untaken prior-week high at 7746.50.
  • The daily candle rejected below the 7644.48 EMA21 and used almost one ADR, but its modest body and recovery from 7493 indicate sellers failed to retain control near the low.
  • H1 closed above its 7544.15 EMA21 after a four-hour recovery; acceptance above 7560 favors 7598-7601, whereas loss of 7540 would expose 7520 and 7493.

Metrics

  • The completed daily range was 105.75 points, 0.971 ADR, with a 24.35% bearish body and volume at 1.109 times the 30-day average.
  • The final H1 bar closed at 7555 above its 7544.15 EMA21; its 17.25-point range remained just below the 18.5-point expansion threshold.
  • Major SPY drivers were mixed but net adverse: NVDA fell 5.47%, MSFT 2.20% and AAPL 0.62%, while AMZN gained 1.48%, AVGO 3.91% and Berkshire 1.41%; proxy weights and quotes come from https://www.ssga.com/us/en/intermediary/etfs/state-street-spdr-sp-500-etf-trust-spy.

Sentiment & current events

  • Russia-Ukraine talks were described as constructive and were expected to continue November 11, modestly reducing geopolitical risk without determining the index path: https://www.pbs.org/newshour/world/russia-and-ukraine-hold-nearly-4-hours-of-u-s-mediated-talks-in-abu-dhabi.
  • The strongest contradiction is the weak NVDA and MSFT tape against the bullish H1 recovery.
Sources & evidence dates · 36
  1. bls.gov2026-11-10
  2. bls.gov2026-11-06
  3. Russia and Ukraine completed nearly four hours of U.S.-mediated talks in Abu Dhabi; U.S. and Ukrainian officials characterized the session as productive or constructive, with negotiations expected to continue November 11.2026-11-10T13:09:00-05:00
  4. reuters.com2026-11-07T13:36:00Z
  5. cmegroup.com2026-11-10
  6. cnbc.com2026-11-10
  7. Yahoo2026-11-10T21:49:09.000Z
  8. Yahoo2026-11-10T21:45:21.000Z
  9. Yahoo2026-11-10T21:44:59.000Z
  10. Yahoo2026-11-10T21:49:05.000Z
  11. Yahoo2026-11-10T21:43:00.000Z
  12. Yahoo2026-11-10T21:38:17.000Z
  13. Yahoo2026-11-10T20:31:51.000Z
  14. Yahoo2026-11-10T20:07:56.000Z
  15. Yahoo2026-11-10T20:02:00.000Z
  16. Yahoo2026-11-10T21:30:57.000Z
  17. Yahoo2026-11-10T21:22:00.000Z
  18. Yahoo2026-11-10T21:55:28.000Z
  19. Yahoo2026-11-10T21:30:00.000Z
  20. Yahoo2026-11-10T19:41:42.000Z
  21. Yahoo2026-11-10T19:39:27.000Z
  22. Yahoo2026-11-10T19:33:00.000Z
  23. Yahoo2026-11-10T21:26:53.000Z
  24. Yahoo2026-11-10T21:18:42.000Z
  25. Yahoo2026-11-10T20:09:43.000Z
  26. Yahoo2026-11-10T19:30:06.000Z
  27. Yahoo2026-11-10T18:46:26.000Z
  28. Yahoo2026-11-10T19:00:00.000Z
  29. Yahoo2026-11-10T18:45:29.000Z
  30. Yahoo2026-11-10T21:07:00.000Z
  31. Yahoo2026-11-10T19:55:26.000Z
  32. Yahoo2026-11-10T19:40:39.000Z
  33. SeekingAlpha2026-11-10T08:30:45.000Z
  34. Yahoo2026-11-10T05:31:02.000Z
  35. Yahoo2026-11-10T04:20:00.000Z
GC / MGCGold / Micro GoldWeekly thesis · STRESSED

The Lines in the Sand

4,075Reclaim it hourly and the downside case loses its grip.
4,055Failure below here reopens the slide toward 4021.
4,020.9Weekly low; the floor under this failed breakout.

The Trap

Breakout bulls who chased the run through 4156 are the offside crowd now, holding above a level that failed. The other trap is late shorts piling in after an oversized drop, right where snapbacks tend to start.

Last price4,040.5
ADR · 30 sessions80.34 pts
Daily EMA214,087.93LOSS
Reopen gapUP · 2.9 ptsFilled
3,9253,9503,9754,0004,0254,0504,0754,1004,1254,1504,175close 13:30Wed 8:20close 13:30Thu 8:20close 13:30Fri 8:20close 13:30Mon 8:20close 13:30Tue 8:20close 13:30Prior week high · 4,156H1 · EMA21 · GC / MGC 4,040.5Yellow: 08:20 open · dashed gray: 13:30 close (ET)

The Read

Bulls broke out, then got trapped. Price swept 4156, printed 4158.7 and collapsed back under the 4074.6 weekly open to 4040.5. The daily bar was a full-bodied drop through 4087.93, and the hourly rebound off 4020.9 has been shallow. The counterpunch is real: central banks and ETFs kept accumulating in Q3, and a range this big invites a snapback. Fail below 4055 and 4021, then 3990, come into view; reclaim 4075 and the bearish lean loses its footing.

Yesterday's daily candle · Tue, Nov 10
Open4,149.7High4,156.4Low4,020.9Close4,040.5
bearish · range 135.5 pts
Projected range · next session84 pts3,988 – 4,072
Evidence · 8 cited findings

Price action · weekly / daily / H1

  • The weekly candle swept 4156 resistance, failed to accept above the prior-week high, and reversed below its 4074.60 open, creating a bearish failed-breakout structure.
  • The daily candle lost the 4087.93 EMA21 with an 80.6% bearish body and a 1.69-ADR range; this is decisive downside displacement, though the oversized range raises snapback risk.
  • H1 remains below its falling 4070.64 EMA21 after only a shallow rebound from 4020.90; failure below 4055 favors renewed pressure toward 4021 and 3990, while reclaiming 4075 would weaken the continuation case.

Metrics

  • The completed daily range was 135.5 points, 1.687 ADR, with a 109.2-point bearish body and volume at 1.038 times the 30-day average.
  • The final H1 bar closed at 4040.5 below its 4070.64 EMA21; its 8.4-point range was compressed below the 23.9-point expansion threshold.
  • The 2.9-point upward reopen gap was already filled; its historical bucket showed a 95.83% same-session fill rate from 48 observations, so no unfilled current-session gap remains.

Sentiment & current events

  • World Gold Council Q3 data show 321.2 tonnes of central-bank buying and 211.2 tonnes of ETF inflows, structural demand that opposes the bearish read: https://www.gold.org/goldhub/research/gold-demand-trends/gold-demand-trends-q3-2026.
  • The strongest contradiction is robust central-bank and ETF demand against the decisive bearish price displacement.
Sources & evidence dates · 8
  1. bls.gov2026-11-10
  2. bls.gov2026-11-06
  3. gold.org2026-11-03
  4. Russia and Ukraine completed nearly four hours of U.S.-mediated talks in Abu Dhabi; U.S. and Ukrainian officials characterized the session as productive or constructive, with negotiations expected to continue November 11.2026-11-10T13:09:00-05:00
  5. reuters.com2026-11-07T13:36:00Z
  6. cmegroup.com2026-11-10
  7. cnbc.com2026-11-10
CL / MCLWTI Crude Oil / Micro WTI Crude OilWeekly thesis · FULFILLED

The Lines in the Sand

87.4Acceptance above it breaks the bearish overnight structure.
85.75Hourly close below confirms the next leg lower.
83.88Weekly flush low where the long wick was born.

The Trap

After a long lower wick, late shorts tend to chase the move right into a bounce. Bulls get caught too when they mistake a corrective pop toward 86.90-87.40 for a new trend.

Last price86.43
ADR · 30 sessions4.08 pts
Daily EMA2193.84REJECT
Reopen gapNo opening gap
8486889092949698close 14:30Wed 9:00close 14:30Thu 9:00close 14:30Fri 9:00close 14:30Mon 9:00close 14:30Tue 9:00close 14:30Prior week low · 86.61H1 · EMA21 · CL / MCL 86.43Yellow: 09:00 open · dashed gray: 14:30 close (ET)

The Read

Bears own the week, but bulls just landed a punch. Oil broke below the 86.61 prior-week low and accepted there, flushed to 83.88, then ripped back to 86.43 and reclaimed its hourly average. The trend is still down, with price far below the 93.84 daily average. The counter-argument is supply risk from Hormuz and Iran tensions, and fresh inventory data is missing until the holiday-delayed EIA release on November 12. Close an hour below 85.75 and 84.80-83.88 opens up; accept above 87.40 and the bearish structure breaks.

Yesterday's daily candle · Tue, Nov 10
Open86.4High86.96Low83.88Close86.43
doji · range 3.08 pts
Projected range · next session2.9 pts84.45 – 87.35
Evidence · 10 cited findings

Price action · weekly / daily / H1

  • Weekly structure is decisively bearish: price accepted below the prior-week low of 86.61 after falling from 90.82, leaving 83.88 as the immediate downside reference.
  • The daily doji recovered sharply from 83.88 but remains 1.82 ADR below the 93.84 EMA21; the long lower rejection warns against chasing shorts even though the dominant trend remains down.
  • H1 reclaimed its 86.13 EMA21 late in the session, supporting a corrective test of 86.90-87.40 before sellers potentially reappear; an H1 close below 85.75 would confirm renewed expansion toward 84.80-83.88.

Metrics

  • The completed daily range was 3.08 points, 0.754 ADR, with a 0.97% doji body and volume at 1.305 times the 30-day average.
  • The final H1 bar closed at 86.43 above its 86.13 EMA21; its 0.47-point range remained below the 0.82-point expansion threshold.
  • The week has already traded 7.54 points from 91.42 to 83.88 and has accepted below the 86.61 prior-week low.
  • No current-week EIA inventory report was available; the next official report is holiday-delayed to November 12 at 12:00 ET: https://www.eia.gov/petroleum/supply/weekly/schedule.php.

Sentiment & current events

  • Russia-Ukraine talks were described as constructive and continue November 11, a modest bearish demand-risk influence without a final outcome: https://www.pbs.org/newshour/world/russia-and-ukraine-hold-nearly-4-hours-of-u-s-mediated-talks-in-abu-dhabi.
  • Search evidence suggested continuing Hormuz incidents and broader restrictions on Iranian commerce, but exact current traffic severity and supplied strike claims were not directly verified: https://www.reuters.com/world/middle-east/expanding-naval-blockade-us-military-looks-restrict-iranian-land-commerce-2026-11-07/.
  • The strongest contradiction is asymmetric upside supply risk from continuing Hormuz and Iran tensions against the bearish price structure.
Sources & evidence dates · 6
  1. bls.gov2026-11-06
  2. The EIA Weekly Petroleum Status Report for the week ending November 6, 2026 is holiday-delayed to Thursday, November 12 at 12:00 ET because of Veterans Day.
  3. Russia and Ukraine completed nearly four hours of U.S.-mediated talks in Abu Dhabi; U.S. and Ukrainian officials characterized the session as productive or constructive, with negotiations expected to continue November 11.2026-11-10T13:09:00-05:00
  4. reuters.com2026-11-07T13:36:00Z
  5. cmegroup.com2026-11-10

Free. Always. Futures trading edge in your inbox.

You're in. Watch your inbox.

We do not send junk mail. We do not spam.