Session Prep

Two minutes tonight. A plan tomorrow.
Evening edition · Data as of Mon, Nov 9, 5:00 PM EST · All times Eastern
Deep research

Tonight's one thing

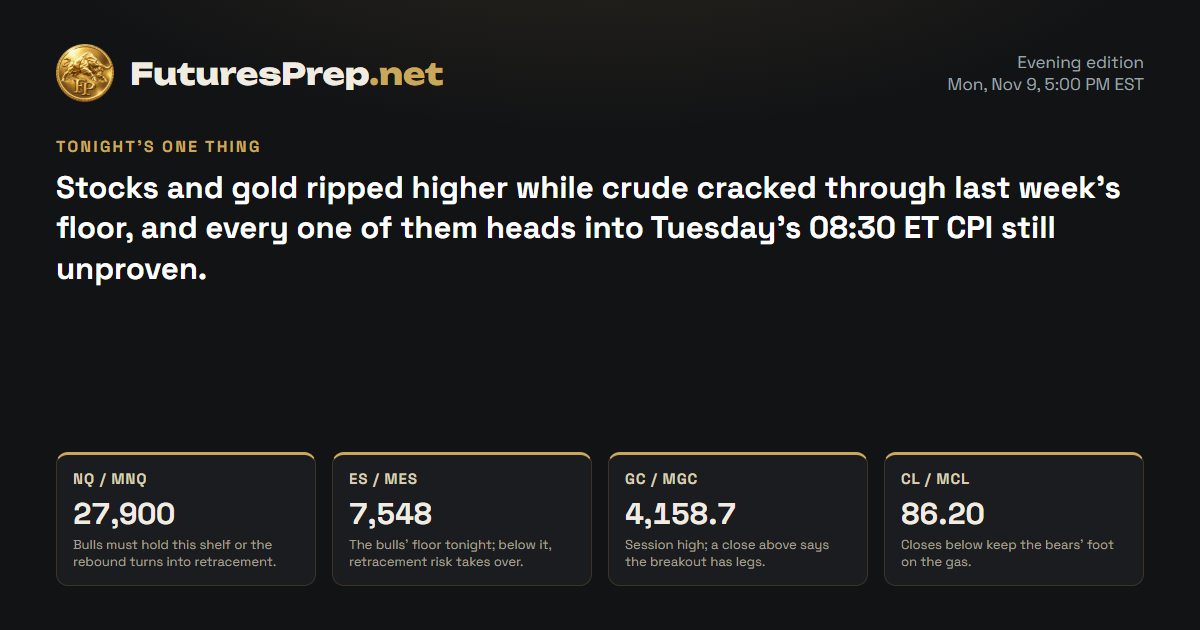
Stocks and gold ripped higher while crude cracked through last week's floor, and every one of them heads into Tuesday's 08:30 ET CPI still unproven.

Tomorrow's market movers · Tuesday, November 10

Time ETImpactEventForecastPrevious
4:00 AMMediumFOMC Member Waller Speaks——
8:30 AMHighCore CPI m/m0.2%0.3%
8:30 AMHighCPI m/m0.3%0.6%

U.S. releases, high and medium impact.

NQ / MNQE-mini / Micro E-mini Nasdaq-100Weekly thesis · STRESSED

The Lines in the Sand

27,900Bulls must hold this shelf or the rebound turns into retracement.
28,129.25Session high; a close above reopens overnight momentum.
28,932.5Daily average overhead, the ceiling this rally hasn't touched yet.

The Trap

Latecomers who missed the rebound tend to chase the session high right under the daily average. A CPI-morning dip back under 27900 then flushes them out.

Last price28,073.25
ADR · 30 sessions681.73 pts
Daily EMA2128,932.5REJECT
Reopen gapNo opening gap
26,50027,00027,50028,00028,50029,000close 16:00Tue 9:30close 16:00Wed 9:30close 16:00Thu 9:30close 16:00Fri 9:30close 16:00Mon 9:30close 16:00Prior week high · 28,970.75Prior week low · 26,367.25H1 · EMA21 · NQ / MNQ 28,073.25Yellow: 09:30 open · dashed gray: 16:00 close (ET)

The Read

Shorts leaning on last week's slide got run over. Price rebounded from 26737.25, closed at 28073.25 near the 28129.25 high, and reclaimed the 27107.25 prior-week close. The big caps carried the move, but Nvidia sank hard, and that is a crack in the leadership. The rally is also stretched: it is still well below the 28932.50 daily average, with CPI at 08:30 ET and Fed speakers Waller and Bowman on deck Tuesday. The lean stays with the bulls, but loosely: hold above 27900 and a close over 28129.25 opens the door toward 28932.50, while losing 27900 hands the tape to retracement risk.

Yesterday's daily candle · Mon, Nov 9
Open26,879.25High28,129.25Low26,737.25Close28,073.25
bullish · range 1,392 pts
Projected range · next session540 pts27,870 – 28,410

Index drivers

Nvidia fell sharply as headlines swirled around a scandal involving CEO Jensen Huang, the lone decliner among the Nasdaq heavyweights. Microsoft, Apple, Amazon, Meta, Broadcom, Alphabet and Tesla all closed higher, with Broadcom and Tesla among the strongest. Nvidia's next earnings are scheduled for 2026-11-17 after the close.

Market data as of Nov 9, 6:33 PM EST · Weights as of 2026-09-30

Evidence · 10 cited findings

Price action · weekly / daily / H1

  • Price action first record: bullish. Price rebounded from 26737.25 and closed at 28073.25, above the 27107.25 prior-week close but below 28970.75 resistance.
  • The 1250-point bullish daily body closed near the 28129.25 high on 1.18x average volume, supporting continuation after consolidation.
  • The session used 2.04 ADR and remained 1.26 ADR below the 28932.50 daily EMA21, making extension and overhead resistance the strongest contradiction.
  • H1 recovered above its rising EMA21 and held near the high after 09:00-10:00 expansion; a close below 27900 would indicate exhaustion and invalidate the immediate bullish path.

Metrics

  • The final 16:00 H1 bar spanned 106.25 points versus a 105-point expansion threshold, but the forecast requires a close above 28129.25 for renewed overnight expansion.
  • Seven of the eight supplied QQQ driver quotes were positive while NVDA fell 4.2703%; this is supplemental breadth context only and does not alter price action direction or attribution. Source: https://www.invesco.com/qqq-etf/en/about.html
  • The projected candle is a scenario, not an observation: 28073.25 open, 28410 high, 27870 low and 28255 close.

Sentiment & current events

  • Reuters corroborated a risk-on rebound, reporting approximately 2.67% for the Nasdaq while crude fell; this supports the observed rebound but does not confirm continuation above 28129.25. https://www.reuters.com/business/wall-st-futures-rise-after-rough-week-nvidia-unsettles-investors-2026-11-09
  • Federal Reserve appearances include Waller at 04:00 ET and Bowman at 08:40 ET, adding event risk around the forecast close. https://www.federalreserve.gov/newsevents/2026-November.htm
  • The Treasury schedule supports a November 10 ten-year note auction, but its directional market effect is unknown. https://home.treasury.gov/system/files/221/TentativeAuctionScheduleQ42026.pdf
Sources & evidence dates · 30
  1. bls.gov2026-11-03
  2. The Federal Reserve calendar lists Waller at 04:00 ET and Bowman at 08:40, 15:30 and 18:30 ET on November 10. It also confirms that November 11 statistical releases move to November 12 because of Veterans Day.2025-11-03
  3. home.treasury.gov
  4. reuters.com2026-11-09
  5. tradingview.com2026-11-09
  6. Yahoo2026-11-09T21:54:45.000Z
  7. Yahoo2026-11-09T21:51:21.000Z
  8. Yahoo2026-11-09T21:45:05.000Z
  9. Yahoo2026-11-09T21:06:08.000Z
  10. Yahoo2026-11-09T21:00:00.000Z
  11. Yahoo2026-11-09T20:37:52.000Z
  12. Yahoo2026-11-09T18:57:11.000Z
  13. Yahoo2026-11-09T18:19:07.000Z
  14. Yahoo2026-11-09T18:05:31.000Z
  15. Yahoo2026-11-09T18:43:42.000Z
  16. Yahoo2026-11-09T18:43:29.000Z
  17. Yahoo2026-11-09T18:40:24.000Z
  18. Yahoo2026-11-09T20:58:01.000Z
  19. Yahoo2026-11-09T19:56:37.000Z
  20. Yahoo2026-11-09T19:36:53.000Z
  21. Yahoo2026-11-09T20:45:31.000Z
  22. Yahoo2026-11-09T19:08:00.000Z
  23. Yahoo2026-11-09T18:05:38.000Z
  24. Yahoo2026-11-09T21:44:48.000Z
  25. Yahoo2026-11-09T20:55:34.000Z
  26. Yahoo2026-11-09T20:50:00.000Z
  27. Yahoo2026-11-09T20:25:00.000Z
  28. Yahoo2026-11-09T19:51:09.000Z
  29. Yahoo2026-11-09T19:41:17.000Z
ES / MESE-mini / Micro E-mini S&P 500Weekly thesis · STRESSED

The Lines in the Sand

7,548The bulls' floor tonight; below it, retracement risk takes over.
7,601.25Session high; a close above says the coil is breaking.
7,653.58Daily average overhead, the first real wall for this rebound.

The Trap

The range shrank into the close, and a quiet drift near the high tends to lure momentum chasers in late. They get shaken out if a CPI-morning swing drops price back under 7548.

Last price7,580
ADR · 30 sessions107.18 pts
Daily EMA217,653.58REJECT
Reopen gapNo opening gap
7,3007,3507,4007,4507,5007,5507,6007,6507,7007,750close 16:00Tue 9:30close 16:00Wed 9:30close 16:00Thu 9:30close 16:00Fri 9:30close 16:00Mon 9:30close 16:00Prior week high · 7,746.5Prior week low · 7,322.25H1 · EMA21 · ES / MES 7,580Yellow: 09:30 open · dashed gray: 16:00 close (ET)

The Read

Bears pressing last week's slide got squeezed as price climbed from 7360.75 and closed at 7580, back above the 7404 prior-week close. Ten of the eleven heavyweights rose, and Nvidia was the odd one out. The tell is the shrinking range into the close: momentum cooled under the 7601.25 high, and the 7653.58 daily average still sits overhead after an unusually large session. The edge tilts only slightly to the bulls: hold 7548 and a close above 7601.25 opens the path to 7653.58, while losing 7548 knocks out the floor and turns this into retracement risk.

Yesterday's daily candle · Mon, Nov 9
Open7,371High7,601.25Low7,360.75Close7,580
bullish · range 240.5 pts
Projected range · next session94 pts7,548 – 7,642

Index drivers

Nvidia dropped hard on headlines about a scandal around CEO Jensen Huang, the only decliner among the S&P heavyweights. AMD surged on a revived AI chip trade, while Micron, Meta, Tesla, Amazon, Microsoft, Apple, Broadcom, Alphabet and Berkshire Hathaway all finished higher. Nvidia's next earnings are scheduled for 2026-11-17 after the close.

Market data as of Nov 9, 6:33 PM EST · Weights as of 2026-10-01

Evidence · 10 cited findings

Price action · weekly / daily / H1

  • Price action first record: bullish. Price closed the opening weekly session at 7580, above the 7404 prior-week close but below the 7746.50 prior-week high.
  • The daily candle formed a 209-point bullish body and closed in the upper portion of a 2.24-ADR range.
  • Price remains below the 7653.58 daily EMA21, which is the strongest contradiction and nearby resistance after an unusually large session.
  • H1 maintained higher highs from 7385.50 to 7601.25 and closed above its H1 EMA21, but late-session range contraction favors consolidation before expansion.

Metrics

  • The final H1 range was 13.5 points, below the 18.5-point threshold; renewed expansion requires a close above 7601.25.
  • Ten of the eleven supplied SPY driver quotes were positive while NVDA fell 4.2703%; this is supplemental breadth context only and does not alter price action direction or attribution. Source: https://www.ssga.com/us/en/intermediary/etfs/state-street-spdr-sp-500-etf-trust-spy
  • The projected candle is a scenario, not an observation: 7580 open, 7642 high, 7548 low and 7612 close.

Sentiment & current events

  • Reuters reported an approximately 2.41% S&P 500 gain alongside falling crude, corroborating the rebound without confirming continuation above 7601.25. https://www.reuters.com/business/wall-st-futures-rise-after-rough-week-nvidia-unsettles-investors-2026-11-09
  • Federal Reserve appearances include Waller at 04:00 ET and Bowman at 08:40 ET, creating event risk around and after the forecast window. https://www.federalreserve.gov/newsevents/2026-November.htm
  • The Treasury schedule supports a November 10 ten-year note auction, but no verified directional effect is assigned. https://home.treasury.gov/system/files/221/TentativeAuctionScheduleQ42026.pdf
Sources & evidence dates · 39
  1. bls.gov2026-11-03
  2. The Federal Reserve calendar lists Waller at 04:00 ET and Bowman at 08:40, 15:30 and 18:30 ET on November 10. It also confirms that November 11 statistical releases move to November 12 because of Veterans Day.2025-11-03
  3. home.treasury.gov
  4. reuters.com2026-11-09
  5. tradingview.com2026-11-09
  6. Yahoo2026-11-09T21:54:45.000Z
  7. Yahoo2026-11-09T21:51:21.000Z
  8. Yahoo2026-11-09T21:45:05.000Z
  9. Yahoo2026-11-09T21:06:08.000Z
  10. Yahoo2026-11-09T21:00:00.000Z
  11. Yahoo2026-11-09T20:37:52.000Z
  12. Yahoo2026-11-09T18:57:11.000Z
  13. Yahoo2026-11-09T18:19:07.000Z
  14. Yahoo2026-11-09T18:05:31.000Z
  15. Yahoo2026-11-09T18:43:42.000Z
  16. Yahoo2026-11-09T18:43:29.000Z
  17. Yahoo2026-11-09T18:40:24.000Z
  18. Yahoo2026-11-09T20:58:01.000Z
  19. Yahoo2026-11-09T19:56:37.000Z
  20. Yahoo2026-11-09T19:36:53.000Z
  21. Yahoo2026-11-09T20:45:31.000Z
  22. Yahoo2026-11-09T19:08:00.000Z
  23. Yahoo2026-11-09T18:05:38.000Z
  24. Yahoo2026-11-09T21:44:48.000Z
  25. Yahoo2026-11-09T20:55:34.000Z
  26. Yahoo2026-11-09T20:50:00.000Z
  27. Yahoo2026-11-09T20:25:00.000Z
  28. Yahoo2026-11-09T19:51:09.000Z
  29. Yahoo2026-11-09T19:41:17.000Z
  30. Yahoo2026-11-09T19:50:00.000Z
  31. Yahoo2026-11-09T19:35:54.000Z
  32. Yahoo2026-11-09T17:52:31.000Z
  33. Yahoo2026-11-09T21:41:06.000Z
  34. Yahoo2026-11-09T21:24:17.000Z
  35. Yahoo2026-11-09T21:23:00.000Z
  36. Yahoo2026-11-09T11:35:43.000Z
  37. Yahoo2026-11-09T11:05:08.000Z
  38. Yahoo2026-11-09T11:02:59.000Z
GC / MGCGold / Micro GoldWeekly thesis · FULFILLED

The Lines in the Sand

4,158.7Session high; a close above says the breakout has legs.
4,156Last week's high, poked through but not held.
4,124Lose it and the 4125-4110 shelf comes into play.

The Trap

Breakout chasers piled in on the poke above 4156, but price settled back at 4149.80. A break that isn't accepted like that tends to leave latecomers offside if CPI firms up the dollar.

Last price4,149.8
ADR · 30 sessions78.25 pts
Daily EMA214,092.7RECLAIM
Reopen gapNo opening gap
3,9003,9504,0004,0504,1004,150close 13:30Tue 8:20close 13:30Wed 8:20close 13:30Thu 8:20close 13:30Fri 8:20close 13:30Mon 8:20close 13:30Prior week high · 4,156Prior week low · 3,888.7H1 · EMA21 · GC / MGC 4,149.8Yellow: 08:20 open · dashed gray: 13:30 close (ET)

The Read

Gold bulls punched through the 4092.70 daily average and last week's 4156 high, but couldn't settle above it and closed at 4149.80. Reuters tied the lift to a softer dollar and cheaper oil easing inflation worries. The flaw is that the breakout was poked, not accepted, and the 08:30 ET CPI Tuesday could jolt the dollar and yields fast. The lean favors the bulls: a close above 4158.70 opens the door, while losing 4124 sends price rotating toward the 4125-4110 area.

Yesterday's daily candle · Mon, Nov 9
Open4,074.6High4,158.7Low4,062.3Close4,149.8
bullish · range 96.4 pts
Projected range · next session68 pts4,124 – 4,192
Evidence · 10 cited findings

Price action · weekly / daily / H1

  • Price action first record: bullish. Price exceeded the 4156 prior-week high and closed at 4149.80, preserving breakout pressure without confirming acceptance above that high.
  • The daily candle reclaimed the 4092.70 EMA21 with a 75.2-point bullish body and closed near the 4158.70 high after using 1.23 ADR.
  • H1 remained above a rising EMA21 after the 14:00 breakout and consolidated tightly near 4150 into settlement.
  • Closing back below the prior-week high after briefly exceeding it is the strongest contradiction; failure around 4158.70 could rotate price toward the documented 4125-4110 support area.

Metrics

  • The final H1 range was 12.1 points, below the 23.9-point expansion threshold; a close above 4158.70 is required for renewed expansion.
  • Daily volume was approximately 1.072x its 30-session average, supporting the move without indicating extreme participation.
  • The projected candle is a scenario, not an observation: 4149.8 open, 4192 high, 4124 low and 4176 close.

Sentiment & current events

  • Reuters reported gold rising more than 1% as the dollar eased and lower crude reduced inflation anxiety, corroborating the bullish backdrop while leaving post-CPI direction unresolved. https://www.reuters.com/world/india/gold-gains-more-than-1-softer-oil-prices-ease-inflation-worries-2026-11-09/
  • Federal Reserve appearances include Waller at 04:00 ET and Bowman at 08:40 ET, creating dollar-and-yield event risk. https://www.federalreserve.gov/newsevents/2026-November.htm
  • A November 10 ten-year Treasury auction is scheduled, but its effect on gold is a scenario rather than a verified directional fact. https://home.treasury.gov/system/files/221/TentativeAuctionScheduleQ42026.pdf
Sources & evidence dates · 6
  1. bls.gov2026-11-03
  2. The Federal Reserve calendar lists Waller at 04:00 ET and Bowman at 08:40, 15:30 and 18:30 ET on November 10. It also confirms that November 11 statistical releases move to November 12 because of Veterans Day.2025-11-03
  3. home.treasury.gov
  4. Reuters reported gold rising more than 1% on November 9 as the dollar eased and lower crude reduced inflation anxiety, while markets awaited CPI. This corroborates the stated macro backdrop for MGC but leaves post-CPI direction unresolved.2026-11-09
  5. tradingview.com2026-11-09
CL / MCLWTI Crude Oil / Micro WTI Crude OilWeekly thesis · FULFILLED

The Lines in the Sand

86.2Closes below keep the bears' foot on the gas.
88.3Recovery above flips control toward a short-covering bounce.
85.01Session low, the floor bears keep leaning on.

The Trap

After a flush this far below the 94.56 daily average, late shorts tend to pile in at the lows. A short-covering pop back toward 87.19 then squeezes them.

Last price86.4
ADR · 30 sessions4.13 pts
Daily EMA2194.56REJECT
Reopen gapNo opening gap
8486889092949698100close 14:30Tue 9:00close 14:30Wed 9:00close 14:30Thu 9:00close 14:30Fri 9:00close 14:30Mon 9:00close 14:30Prior week low · 86.61H1 · EMA21 · CL / MCL 86.4Yellow: 09:00 open · dashed gray: 14:30 close (ET)

The Read

Bulls got run out. Crude broke and held below the 86.61 prior-week low, hit 85.01 and closed at 86.40 on heavy volume. The bounce off the low stalled near 87.19, a tell that the bears still own the tape. The evidence clearly favors the downside, but the stretch is real. EIA data showing lower crude and distillate inventories alongside busy refineries is the strongest argument against the bears, and CPI at 08:30 ET Tuesday adds a wildcard. Closes below 86.20 keep 85.01 under fire; a recovery above 88.30 hands the wheel to short-covering.

Yesterday's daily candle · Mon, Nov 9
Open90.82High91.42Low85.01Close86.4
bearish · range 6.41 pts
Projected range · next session3.2 pts84.45 – 87.65
Evidence · 10 cited findings

Price action · weekly / daily / H1

  • Price action first record: bearish. Price broke and accepted below the 86.61 prior-week low, closing the opening weekly session at 86.40 after reaching 85.01.
  • The daily candle produced a 4.42-point bearish body on 1.84x average volume and closed 1.98 ADR below the 94.56 EMA21.
  • H1 remained below a sharply declining EMA21, and the bounce from 85.01 failed near 87.19 before settlement.
  • The 1.55-ADR extension creates short-covering risk, but closes below 86.20 favor another test of 85.01; recovery above 88.30 would weaken immediate bearish control.

Metrics

  • The final H1 range was 0.89 versus a 0.82 expansion threshold; renewed bearish expansion requires a close below 86.20.
  • EIA reported commercial crude inventories down 0.9 million barrels to 409.8 million, distillates down 3.6 million and refinery utilization at 94.5%; these are the strongest verified contradiction to the bearish read. https://www.eia.gov/petroleum/supply/weekly/pdf/highlights.pdf
  • The projected candle is a scenario, not an observation: 86.40 open, 87.65 high, 84.45 low and 85.35 close.

Sentiment & current events

  • Reuters reported falling crude alongside the November 9 equity rebound, corroborating current downside pressure without validating the exact 86.20 trigger. https://www.reuters.com/business/wall-st-futures-rise-after-rough-week-nvidia-unsettles-investors-2026-11-09
  • The verified EIA inventory and refinery data are supportive relative to inventories but do not independently establish near-term bullish direction. https://www.eia.gov/petroleum/supply/weekly/pdf/highlights.pdf
  • Primary confirmation of reported Middle East tanker incidents and the official OPEC+ communiqué was not reviewed, leaving geopolitical and supply-policy risk incompletely verified.
Sources & evidence dates · 5
  1. bls.gov2026-11-03
  2. The EIA report for the week ending October 30 confirms commercial crude inventories fell 0.9 million barrels to 409.8 million, distillate inventories fell 3.6 million, refinery utilization reached 94.5%, and commercial crude inventories were 2.7% below the year-earlier level. These data are supportive relative to inventories but do not independently establish bullish near-term MCL direction.2026-11-04
  3. reuters.com2026-11-09
  4. tradingview.com2026-11-09

Free. Always. Futures trading edge in your inbox.

You're in. Watch your inbox.

We do not send junk mail. We do not spam.