Session Prep

Two minutes tonight. A plan tomorrow.
Morning review · Data as of Tue, Nov 10, 7:00 AM EST · All times Eastern
Deep research

This morning's one thing

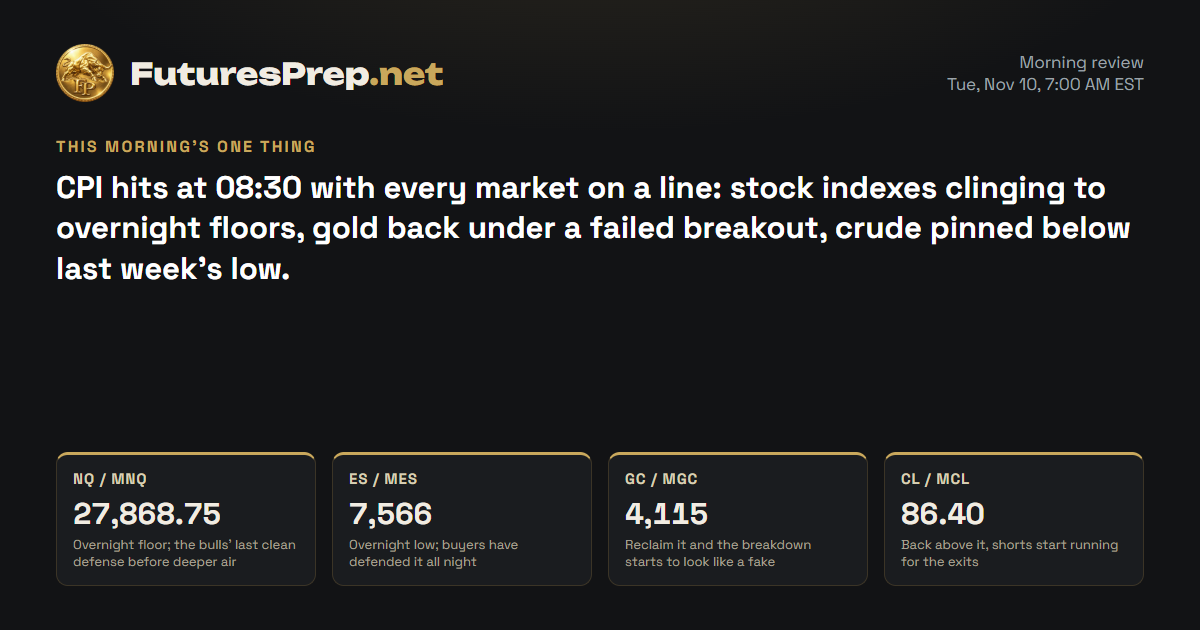
CPI hits at 08:30 with every market on a line: stock indexes clinging to overnight floors, gold back under a failed breakout, crude pinned below last week's low.

Today's market movers · Tuesday, November 10

Time ETImpactEventForecastPrevious
4:00 AMMediumFOMC Member Waller Speaks——
8:30 AMHighCore CPI m/m0.2%0.3%
8:30 AMHighCPI m/m0.3%0.6%

U.S. releases, high and medium impact.

NQ / MNQE-mini / Micro E-mini Nasdaq-100Weekly thesis · STRESSED

The Lines in the Sand

27,868.75Overnight floor; the bulls' last clean defense before deeper air
28,129.25This week's high, where the rebound last ran out of fuel
28,970.75Last week's high, the ceiling the recovery hasn't challenged

The Trap

After a big up week, late longs tend to pile in on any bounce under 28106.50 and get caught when the lower highs keep coming. Shorts who press every dip into 27868.75 often get squeezed when the hourly trend line holds.

Last price27,939.75
ADR · 30 sessions681.73 pts
Daily EMA2128,932.5BELOW
Reopen gapNo opening gap
26,50027,00027,50028,00028,50029,000Tue 9:30close 16:00Wed 9:30close 16:00Thu 9:30close 16:00Fri 9:30close 16:00Mon 9:30close 16:00Prior week high · 28,970.75Prior week low · 26,367.25H1 · EMA21 · NQ / MNQ 27,939.75Dashed: last night's path

The Read

Shorts leaning on last week's slide got run over. Price rebounded from 26737.25, closed at 28073.25 near the 28129.25 high, and reclaimed the 27107.25 prior-week close. The big caps carried the move, but Nvidia sank hard, and that is a crack in the leadership. The rally is also stretched: it is still well below the 28932.50 daily average, with CPI at 08:30 ET and Fed speakers Waller and Bowman on deck Tuesday. The lean stays with the bulls, but loosely: hold above 27900 and a close over 28129.25 opens the door toward 28932.50, while losing 27900 hands the tape to retracement risk.

Morning review · Nov 10, 7:30 AM EST

Buyers ran this market off the 26737.25 low, but overnight the sellers took back ground, fading it from 28106.50 to 27868.75 and leaving price at 27939.75. The hourly trend is still rising underneath, but each bounce is printing a lower high. That is consolidation, not a breakout. The counter-case is real: the overnight low already traded through the prior 27900 line intrabar, and CPI at 08:30 lands with no reliable consensus. Hold 27868.75 and the path back to 28129.25 stays open; an hourly close below it and 27700-27550 comes into play.

Overnight evidence · 9 cited findings

Overnight price action

  • Overnight high was 28106.50, low was 27868.75 and net change was -122.50 points from the evening baseline.
  • Price failed to reach the prior projected 28320 high-path point or 28255 projected close.
  • The latest completed H1 bar closed at 27939.75 above its 27871.50 EMA21.

Overnight events

  • The overnight range preceded the scheduled 08:30 ET CPI and Real Earnings releases, so their actual effects were unavailable.
  • No verified fresh cross-asset snapshot was available to attribute the overnight pullback to yields, the dollar or volatility.

What changed

  • Price action direction remains bullish.
  • The failed overnight projection and lower highs reduce conviction and produce an adjusted verdict.
  • Holding above 27868.75 preserves the bullish recovery scenario.
  • Unobserved CPI and missing live cross-asset data limit confidence.
Yesterday's daily candle · Mon, Nov 9
Open26,879.25High28,129.25Low26,737.25Close28,073.25
bullish · range 1,392 pts
Projected range · next session540 pts27,870 – 28,410

Index drivers

In the prior session, Broadcom, Meta, Tesla, Amazon, Microsoft and Apple all closed higher, while Nvidia fell hard. Nvidia headlines overnight centered on a shareholder lawsuit over Jensen Huang's ties to a suspected spy. Nvidia reports earnings November 17 after the close.

Market data as of Nov 10, 7:33 AM EST · Weights as of 2026-09-30

Evidence · 10 cited findings

Price action · weekly / daily / H1

  • Price action first record: bullish. Price rebounded from 26737.25 and closed at 28073.25, above the 27107.25 prior-week close but below 28970.75 resistance.
  • The 1250-point bullish daily body closed near the 28129.25 high on 1.18x average volume, supporting continuation after consolidation.
  • The session used 2.04 ADR and remained 1.26 ADR below the 28932.50 daily EMA21, making extension and overhead resistance the strongest contradiction.
  • H1 recovered above its rising EMA21 and held near the high after 09:00-10:00 expansion; a close below 27900 would indicate exhaustion and invalidate the immediate bullish path.

Metrics

  • The final 16:00 H1 bar spanned 106.25 points versus a 105-point expansion threshold, but the forecast requires a close above 28129.25 for renewed overnight expansion.
  • Seven of the eight supplied QQQ driver quotes were positive while NVDA fell 4.2703%; this is supplemental breadth context only and does not alter price action direction or attribution. Source: https://www.invesco.com/qqq-etf/en/about.html
  • The projected candle is a scenario, not an observation: 28073.25 open, 28410 high, 27870 low and 28255 close.

Sentiment & current events

  • Reuters corroborated a risk-on rebound, reporting approximately 2.67% for the Nasdaq while crude fell; this supports the observed rebound but does not confirm continuation above 28129.25. https://www.reuters.com/business/wall-st-futures-rise-after-rough-week-nvidia-unsettles-investors-2026-11-09
  • Federal Reserve appearances include Waller at 04:00 ET and Bowman at 08:40 ET, adding event risk around the forecast close. https://www.federalreserve.gov/newsevents/2026-November.htm
  • The Treasury schedule supports a November 10 ten-year note auction, but its directional market effect is unknown. https://home.treasury.gov/system/files/221/TentativeAuctionScheduleQ42026.pdf
Sources & evidence dates · 24
  1. bls.gov2026-11-03
  2. The Federal Reserve calendar lists Waller at 04:00 ET and Bowman at 08:40, 15:30 and 18:30 ET on November 10. It also confirms that November 11 statistical releases move to November 12 because of Veterans Day.2025-11-03
  3. home.treasury.gov
  4. reuters.com2026-11-09
  5. tradingview.com2026-11-09
  6. Yahoo2026-11-10T11:49:38.000Z
  7. Yahoo2026-11-10T11:48:29.000Z
  8. Yahoo2026-11-10T11:42:42.000Z
  9. Yahoo2026-11-10T11:23:19.000Z
  10. Yahoo2026-11-10T11:06:28.000Z
  11. Yahoo2026-11-10T11:06:23.000Z
  12. Yahoo2026-11-10T11:10:06.000Z
  13. Yahoo2026-11-10T11:52:31.000Z
  14. Yahoo2026-11-10T11:06:10.000Z
  15. Yahoo2026-11-10T11:30:00.000Z
  16. Yahoo2026-11-10T11:06:15.000Z
  17. Yahoo2026-11-10T11:10:19.000Z
  18. Yahoo2026-11-10T11:05:15.000Z
  19. Yahoo2026-11-10T11:36:59.000Z
  20. Yahoo2026-11-10T11:25:21.000Z
  21. Yahoo2026-11-10T11:37:27.000Z
  22. Yahoo2026-11-10T11:01:19.000Z
  23. Yahoo2026-11-10T10:55:00.000Z
ES / MESE-mini / Micro E-mini S&P 500Weekly thesis · STRESSED

The Lines in the Sand

7,566Overnight low; buyers have defended it all night
7,601.25Week's high, the lid on a tight coil
7,746.5Last week's high, still unreclaimed overhead

The Trap

Tight overnight ranges bait breakout chasers into the first poke above 7598.75, and the move often snaps back inside before the real break comes. The same goes for the first flush under 7566 ahead of a big data print.

Last price7,581.75
ADR · 30 sessions107.18 pts
Daily EMA217,653.58BELOW
Reopen gapNo opening gap
7,3007,3507,4007,4507,5007,5507,6007,6507,7007,750Tue 9:30close 16:00Wed 9:30close 16:00Thu 9:30close 16:00Fri 9:30close 16:00Mon 9:30close 16:00Prior week high · 7,746.5Prior week low · 7,322.25H1 · EMA21 · ES / MES 7,581.75Dashed: last night's path
Overnight: held

The Read

Bears pressing last week's slide got squeezed as price climbed from 7360.75 and closed at 7580, back above the 7404 prior-week close. Ten of the eleven heavyweights rose, and Nvidia was the odd one out. The tell is the shrinking range into the close: momentum cooled under the 7601.25 high, and the 7653.58 daily average still sits overhead after an unusually large session. The edge tilts only slightly to the bulls: hold 7548 and a close above 7601.25 opens the path to 7653.58, while losing 7548 knocks out the floor and turns this into retracement risk.

Morning review · Nov 10, 7:30 AM EST

Buyers and sellers fought to a draw overnight: price boxed between 7566 and 7598.75 and finished one point from where it started. The hourly bar ranged just 11 points, well under the 18.5-point threshold, so this is a coil, not a move. The strong recovery week from 7371 gives buyers a slight edge, but Nvidia's slide is a leadership crack and CPI at 08:30 can break the coil either way. An hourly close above 7601.25 opens 7630-7655; acceptance below 7566 and 7535-7515 is the fuel for sellers.

Overnight evidence · 10 cited findings

Overnight price action

  • Overnight high was 7598.75, low was 7566 and net change was +1 point from the evening baseline.
  • The prior 7548 invalidation was not crossed.
  • Price did not achieve the prior projected 7624 path high or 7612 close.
  • The latest completed H1 bar closed at 7581.75 above its 7561.22 EMA21.

Overnight events

  • The overnight range preceded the scheduled 08:30 ET CPI and Real Earnings releases, leaving their actual impact unknown.
  • No verified live yields, dollar or volatility data were available to explain the balanced overnight trade.

What changed

  • Price action direction remains bullish.
  • Holding the prior invalidation and H1 EMA21 supports an unchanged verdict.
  • Compression below 7601.25 and daily EMA21 resistance limit conviction.
  • Unobserved CPI remains the dominant missing catalyst.
Yesterday's daily candle · Mon, Nov 9
Open7,371High7,601.25Low7,360.75Close7,580
bullish · range 240.5 pts
Projected range · next session94 pts7,548 – 7,642

Index drivers

In the prior session, AMD, Broadcom, Micron, Tesla, Meta, Amazon, Microsoft and Apple all closed higher, while Nvidia fell sharply. That split leaves the market's single biggest weight going the other way. Nvidia reports earnings November 17 after the close.

Market data as of Nov 10, 7:33 AM EST · Weights as of 2026-10-01

Evidence · 10 cited findings

Price action · weekly / daily / H1

  • Price action first record: bullish. Price closed the opening weekly session at 7580, above the 7404 prior-week close but below the 7746.50 prior-week high.
  • The daily candle formed a 209-point bullish body and closed in the upper portion of a 2.24-ADR range.
  • Price remains below the 7653.58 daily EMA21, which is the strongest contradiction and nearby resistance after an unusually large session.
  • H1 maintained higher highs from 7385.50 to 7601.25 and closed above its H1 EMA21, but late-session range contraction favors consolidation before expansion.

Metrics

  • The final H1 range was 13.5 points, below the 18.5-point threshold; renewed expansion requires a close above 7601.25.
  • Ten of the eleven supplied SPY driver quotes were positive while NVDA fell 4.2703%; this is supplemental breadth context only and does not alter price action direction or attribution. Source: https://www.ssga.com/us/en/intermediary/etfs/state-street-spdr-sp-500-etf-trust-spy
  • The projected candle is a scenario, not an observation: 7580 open, 7642 high, 7548 low and 7612 close.

Sentiment & current events

  • Reuters reported an approximately 2.41% S&P 500 gain alongside falling crude, corroborating the rebound without confirming continuation above 7601.25. https://www.reuters.com/business/wall-st-futures-rise-after-rough-week-nvidia-unsettles-investors-2026-11-09
  • Federal Reserve appearances include Waller at 04:00 ET and Bowman at 08:40 ET, creating event risk around and after the forecast window. https://www.federalreserve.gov/newsevents/2026-November.htm
  • The Treasury schedule supports a November 10 ten-year note auction, but no verified directional effect is assigned. https://home.treasury.gov/system/files/221/TentativeAuctionScheduleQ42026.pdf
Sources & evidence dates · 28
  1. bls.gov2026-11-03
  2. The Federal Reserve calendar lists Waller at 04:00 ET and Bowman at 08:40, 15:30 and 18:30 ET on November 10. It also confirms that November 11 statistical releases move to November 12 because of Veterans Day.2025-11-03
  3. home.treasury.gov
  4. reuters.com2026-11-09
  5. tradingview.com2026-11-09
  6. Yahoo2026-11-10T11:49:38.000Z
  7. Yahoo2026-11-10T11:48:29.000Z
  8. Yahoo2026-11-10T11:42:42.000Z
  9. Yahoo2026-11-10T11:23:19.000Z
  10. Yahoo2026-11-10T11:06:28.000Z
  11. Yahoo2026-11-10T11:06:23.000Z
  12. Yahoo2026-11-10T11:10:06.000Z
  13. Yahoo2026-11-10T11:52:31.000Z
  14. Yahoo2026-11-10T11:06:10.000Z
  15. Yahoo2026-11-10T11:30:00.000Z
  16. Yahoo2026-11-10T11:06:15.000Z
  17. Yahoo2026-11-10T11:10:19.000Z
  18. Yahoo2026-11-10T11:05:15.000Z
  19. Yahoo2026-11-10T11:36:59.000Z
  20. Yahoo2026-11-10T11:25:21.000Z
  21. Yahoo2026-11-10T11:37:27.000Z
  22. Yahoo2026-11-10T11:01:19.000Z
  23. Yahoo2026-11-10T10:55:00.000Z
  24. Yahoo2026-11-10T11:06:06.000Z
  25. Yahoo2026-11-10T05:31:02.000Z
  26. Yahoo2026-11-10T04:20:00.000Z
  27. Yahoo2026-11-10T02:50:00.000Z
GC / MGCGold / Micro GoldWeekly thesis · FULFILLED

The Lines in the Sand

4,115Reclaim it and the breakdown starts to look like a fake
4,076.5Overnight low; the shelf sellers have to crack next
4,062.3Week's low, the last floor before 4035

The Trap

Breakout buyers who chased the poke above last week's 4156 high got left holding it when price failed and fell back to the weekly open. Now the risk flips: shorts chasing a market that has already paused can get caught if a dip below 4076.50 fails and snaps back.

Last price4,082.5
ADR · 30 sessions78.25 pts
Daily EMA214,092.7BELOW
Reopen gapNo opening gap
3,9003,9504,0004,0504,1004,1504,200Tue 8:20close 13:30Wed 8:20close 13:30Thu 8:20close 13:30Fri 8:20close 13:30Mon 8:20close 13:30Prior week high · 4,156Prior week low · 3,888.7H1 · EMA21 · GC / MGC 4,082.5Dashed: last night's path
Overnight: invalidated

The Read

INVALIDATED

Gold bulls punched through the 4092.70 daily average and last week's 4156 high, but couldn't settle above it and closed at 4149.80. Reuters tied the lift to a softer dollar and cheaper oil easing inflation worries. The flaw is that the breakout was poked, not accepted, and the 08:30 ET CPI Tuesday could jolt the dollar and yields fast. The lean favors the bulls: a close above 4158.70 opens the door, while losing 4124 sends price rotating toward the 4125-4110 area.

Morning review · Nov 10, 7:30 AM EST

Buyers took out last week's 4156 high but couldn't hold it, and the sellers punished them, driving price from 4149.70 down to 4082.50 and back below the 4092.70 daily average. The decline was decisive, with a big-bodied daily candle, and the hourly trend is falling beneath 4115.49. The leaning case is to the downside, but the strongest counter is heavy: central banks and ETFs kept adding gold in the third quarter while supply shrank. The latest hourly bar ranged only 8.4 points, so the drop was pausing at the cutoff. An hourly close below 4076.50 puts 4062.30 then 4035 in play; a sustained reclaim of 4115 turns this into a failed breakdown.

Overnight evidence · 10 cited findings

Overnight price action

  • Overnight high was 4156.40, low was 4076.50 and net change was -67.20 points from the evening baseline.
  • Price broke the prior 4124 invalidation and missed the projected 4176 close by 93.50 points.
  • The move erased most of the prior daily bullish reclaim and returned below the 4092.70 daily EMA21.
  • The latest completed H1 bar closed at 4082.50 below its 4115.49 EMA21.

Overnight events

  • The decline occurred before the scheduled 08:30 ET CPI and Real Earnings releases, so their actual impact was unavailable.
  • No verified live dollar or real-yield snapshot was available to attribute the reversal.

What changed

  • Price action direction changed from the prior bullish baseline to bearish.
  • Breaking 4124 and losing both EMA structures requires an INVALIDATED verdict.
  • Failed acceptance above the prior-week high supports the bearish reversal.
  • Verified structural gold demand reduces conviction and raises failed-breakdown risk.
Yesterday's daily candle · Mon, Nov 9
Open4,074.6High4,158.7Low4,062.3Close4,149.8
bullish · range 96.4 pts
Projected range · next session68 pts4,124 – 4,192
Evidence · 10 cited findings

Price action · weekly / daily / H1

  • Price action first record: bullish. Price exceeded the 4156 prior-week high and closed at 4149.80, preserving breakout pressure without confirming acceptance above that high.
  • The daily candle reclaimed the 4092.70 EMA21 with a 75.2-point bullish body and closed near the 4158.70 high after using 1.23 ADR.
  • H1 remained above a rising EMA21 after the 14:00 breakout and consolidated tightly near 4150 into settlement.
  • Closing back below the prior-week high after briefly exceeding it is the strongest contradiction; failure around 4158.70 could rotate price toward the documented 4125-4110 support area.

Metrics

  • The final H1 range was 12.1 points, below the 23.9-point expansion threshold; a close above 4158.70 is required for renewed expansion.
  • Daily volume was approximately 1.072x its 30-session average, supporting the move without indicating extreme participation.
  • The projected candle is a scenario, not an observation: 4149.8 open, 4192 high, 4124 low and 4176 close.

Sentiment & current events

  • Reuters reported gold rising more than 1% as the dollar eased and lower crude reduced inflation anxiety, corroborating the bullish backdrop while leaving post-CPI direction unresolved. https://www.reuters.com/world/india/gold-gains-more-than-1-softer-oil-prices-ease-inflation-worries-2026-11-09/
  • Federal Reserve appearances include Waller at 04:00 ET and Bowman at 08:40 ET, creating dollar-and-yield event risk. https://www.federalreserve.gov/newsevents/2026-November.htm
  • A November 10 ten-year Treasury auction is scheduled, but its effect on gold is a scenario rather than a verified directional fact. https://home.treasury.gov/system/files/221/TentativeAuctionScheduleQ42026.pdf
Sources & evidence dates · 6
  1. bls.gov2026-11-03
  2. The Federal Reserve calendar lists Waller at 04:00 ET and Bowman at 08:40, 15:30 and 18:30 ET on November 10. It also confirms that November 11 statistical releases move to November 12 because of Veterans Day.2025-11-03
  3. home.treasury.gov
  4. Reuters reported gold rising more than 1% on November 9 as the dollar eased and lower crude reduced inflation anxiety, while markets awaited CPI. This corroborates the stated macro backdrop for MGC but leaves post-CPI direction unresolved.2026-11-09
  5. tradingview.com2026-11-09
CL / MCLWTI Crude Oil / Micro WTI Crude OilWeekly thesis · FULFILLED

The Lines in the Sand

86.4Back above it, shorts start running for the exits
84.8Close under it and the slide likely restarts
83.88Week's low; next stop on the board is 82.60

The Trap

After a cascade like this, late shorts tend to pile in far below the average, right where a single Iran or Hormuz headline can rip price back through 86.40. Bottom-pickers get caught the other way when a pause turns into another leg down.

Last price85.27
ADR · 30 sessions4.13 pts
Daily EMA2194.56BELOW
Reopen gapNo opening gap
8486889092949698100Tue 9:00close 14:30Wed 9:00close 14:30Thu 9:00close 14:30Fri 9:00close 14:30Mon 9:00close 14:30Prior week low · 86.61H1 · EMA21 · CL / MCL 85.27Dashed: last night's path
Overnight: held

The Read

Bulls got run out. Crude broke and held below the 86.61 prior-week low, hit 85.01 and closed at 86.40 on heavy volume. The bounce off the low stalled near 87.19, a tell that the bears still own the tape. The evidence clearly favors the downside, but the stretch is real. EIA data showing lower crude and distillate inventories alongside busy refineries is the strongest argument against the bears, and CPI at 08:30 ET Tuesday adds a wildcard. Closes below 86.20 keep 85.01 under fire; a recovery above 88.30 hands the wheel to short-covering.

Morning review · Nov 10, 7:30 AM EST

Sellers broke last week's 86.61 low and kept it broken, pressing crude from 91.42 down to 83.88. The bounce off that low stalled at 85.93, still under the falling hourly average near 86.30, so the bears clearly hold the field. The counter-argument is the stretch: price sits 2.25 ADR below its daily average, the latest hourly range shrank to a pause, and unresolved Iran talks leave a sharp upside tail. An hourly close below 84.80 opens a run through 83.88 toward 82.60; sustained trade back above 86.40 and the short side is offside.

Overnight evidence · 10 cited findings

Overnight price action

  • Overnight high was 86.96, low was 83.88 and net change was -1.13 points from the evening baseline.
  • Price exceeded the prior projected 84.45 low and closed at 85.27 versus the projected 85.35.
  • The prior 88.30 invalidation was never threatened.
  • The latest completed H1 bar closed at 85.27 below its 86.30 EMA21.

Overnight events

  • No verified scheduled petroleum release occurred inside the overnight forecast window.
  • CPI at 08:30 ET was still unobserved and could alter dollar, inflation and demand expectations.

What changed

  • Price action direction remains bearish.
  • Overnight direction and projected settlement were substantially confirmed, supporting an unchanged verdict.
  • Acceptance below the prior-week low and falling EMA structure favor continued downside.
  • Extension and geopolitical supply risk reduce confidence and increase reversal risk.
Yesterday's daily candle · Mon, Nov 9
Open90.82High91.42Low85.01Close86.4
bearish · range 6.41 pts
Projected range · next session3.2 pts84.45 – 87.65
Evidence · 10 cited findings

Price action · weekly / daily / H1

  • Price action first record: bearish. Price broke and accepted below the 86.61 prior-week low, closing the opening weekly session at 86.40 after reaching 85.01.
  • The daily candle produced a 4.42-point bearish body on 1.84x average volume and closed 1.98 ADR below the 94.56 EMA21.
  • H1 remained below a sharply declining EMA21, and the bounce from 85.01 failed near 87.19 before settlement.
  • The 1.55-ADR extension creates short-covering risk, but closes below 86.20 favor another test of 85.01; recovery above 88.30 would weaken immediate bearish control.

Metrics

  • The final H1 range was 0.89 versus a 0.82 expansion threshold; renewed bearish expansion requires a close below 86.20.
  • EIA reported commercial crude inventories down 0.9 million barrels to 409.8 million, distillates down 3.6 million and refinery utilization at 94.5%; these are the strongest verified contradiction to the bearish read. https://www.eia.gov/petroleum/supply/weekly/pdf/highlights.pdf
  • The projected candle is a scenario, not an observation: 86.40 open, 87.65 high, 84.45 low and 85.35 close.

Sentiment & current events

  • Reuters reported falling crude alongside the November 9 equity rebound, corroborating current downside pressure without validating the exact 86.20 trigger. https://www.reuters.com/business/wall-st-futures-rise-after-rough-week-nvidia-unsettles-investors-2026-11-09
  • The verified EIA inventory and refinery data are supportive relative to inventories but do not independently establish near-term bullish direction. https://www.eia.gov/petroleum/supply/weekly/pdf/highlights.pdf
  • Primary confirmation of reported Middle East tanker incidents and the official OPEC+ communiqué was not reviewed, leaving geopolitical and supply-policy risk incompletely verified.
Sources & evidence dates · 5
  1. bls.gov2026-11-03
  2. The EIA report for the week ending October 30 confirms commercial crude inventories fell 0.9 million barrels to 409.8 million, distillate inventories fell 3.6 million, refinery utilization reached 94.5%, and commercial crude inventories were 2.7% below the year-earlier level. These data are supportive relative to inventories but do not independently establish bullish near-term MCL direction.2026-11-04
  3. reuters.com2026-11-09
  4. tradingview.com2026-11-09

Free. Always. Futures trading edge in your inbox.

You're in. Watch your inbox.

We do not send junk mail. We do not spam.