Session Prep

Two minutes tonight. A plan tomorrow.
Evening edition · Data as of Fri, Nov 6, 5:00 PM EST · All times Eastern
Deep research

Tonight's one thing

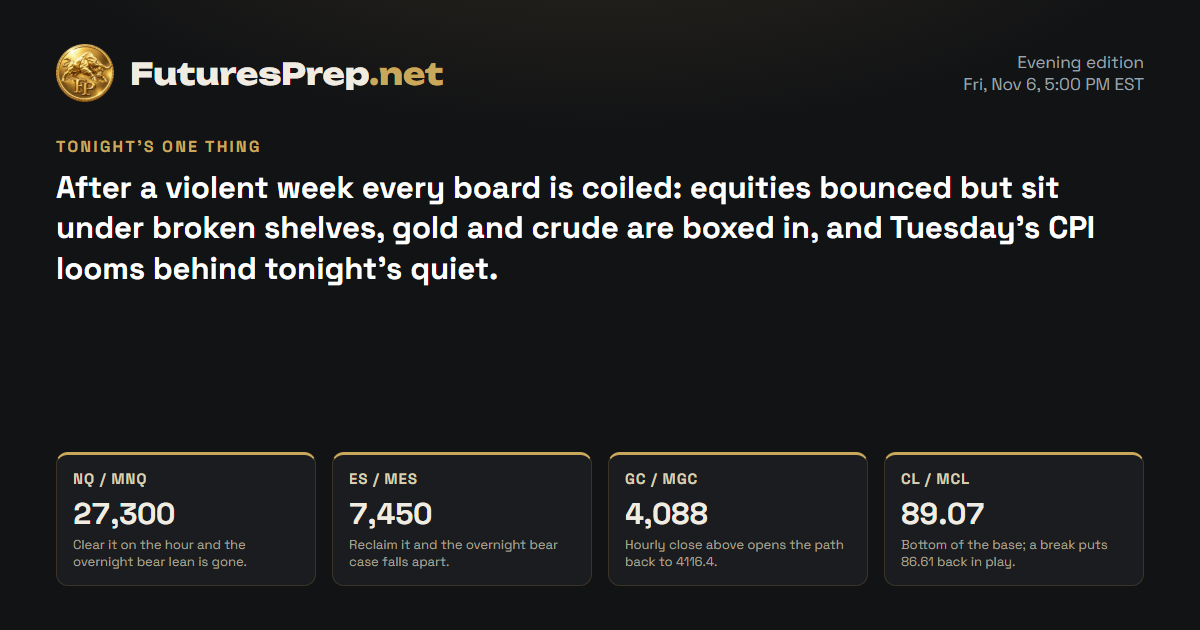
After a violent week every board is coiled: equities bounced but sit under broken shelves, gold and crude are boxed in, and Tuesday's CPI looms behind tonight's quiet.

Tomorrow's market movers · Monday, November 9

No major U.S. releases or tracked driver earnings scheduled.

U.S. releases, high and medium impact.

NQ / MNQE-mini / Micro E-mini Nasdaq-100Weekly thesis · INTACT

The Lines in the Sand

27,300Clear it on the hour and the overnight bear lean is gone.
27,055Hourly close below here hands control back to the bears.
28,232.25Broken weekly shelf the bulls need back to end the slide.

The Trap

The trap runs both ways: late bulls treat Friday's bounce as a bottom while price still sits far under the broken 28232.25 shelf, and late bears press into a compressed tape that already squeezed hard once off 26367.25.

Last price27,107.25
ADR · 30 sessions654.13 pts
Daily EMA2129,020.6REJECT
Reopen gapDOWN · -228 ptsFilled
26,50027,00027,50028,00028,50029,000Mon 9:30close 16:00Tue 9:30close 16:00Wed 9:30close 16:00Thu 9:30close 16:00Fri 9:30close 16:00Prior week low · 28,232.25H1 · EMA21 · NQ / MNQ 27,107.25Yellow: 09:30 open · dashed gray: 16:00 close (ET)

The Read

Bears own the week, but Friday's chip-led rebound off 26367.25 left late shorts offside. Price clawed back to 27107.25, then stalled under the 27425 session high and the daily average up at 29020.6. That squeeze is the strongest argument against the bears, and it still has not repaired the break below 28232.25. The tape went quiet into the close, coiled under resistance between 27250 and 27425. Hold above 27300 and the door opens; lose 27055 and the 26367.25 floor comes back into play.

Yesterday's daily candle · Fri, Nov 6
Open26,635High27,425Low26,367.25Close27,107.25
bullish · range 1,057.75 pts
Projected range · next session310 pts26,880 – 27,190

Index drivers

Friday's heavyweights split: NVDA, TSLA, META, AVGO and GOOGL closed higher, while MSFT, AAPL and AMZN finished lower. NVDA has the next scheduled earnings report, after the close on Nov. 17.

Market data as of Nov 8, 6:34 PM EST · Weights as of 2026-09-30

Evidence · 13 cited findings

Price action · weekly / daily / H1

  • W45 closed bearish at 27107.25 after opening 28587, taking the prior-week low at 28232.25 and accepting below it; the weekly low was 26367.25.
  • Friday rebounded from 26367.25 to a bullish daily close, but the 27107.25 settlement remained below the 27425 session high, the broken 28232.25 shelf and daily EMA21 at 29020.6.
  • The Nov. 5 09:00-10:00 ET decline of roughly 850 points established the structural break; the subsequent recovery has not repaired it.
  • Friday's last completed H1 closed 27107.25 below its approximately 27181.5 EMA21, while 27250-27425 is the nearest resistance zone.
  • The bearish scenario requires an H1 close below 27055; a Sunday reopen above 27300 would invalidate the immediate bearish lean.

Metrics

  • Friday used 1.617 ADR and traded at 1.407 times its 30-session average volume, confirming unusually large participation but also increasing mean-reversion risk.
  • The daily close was 2.925 ADR below EMA21, supporting the higher-timeframe downtrend rather than a confirmed reversal.
  • The final H1 range was 71.75 points versus a 105-point expansion threshold, so the market ended compressed rather than actively expanding.

Sentiment & current events

  • October payrolls rose 165,000, unemployment was 4.1% and earnings rose 0.4% month over month, a rates-sensitive headwind, although the figures are older than the current market snapshot (https://www.bls.gov/news.release/empsit.nr0.htm).
  • October CPI and real earnings are scheduled for Tuesday, Nov. 10 at 08:30 ET, outside this overnight window but relevant to weekly risk (https://www.bls.gov/schedule/2026/11_sched_list.htm).
  • Friday's Nasdaq rose 1.1% and semiconductors gained 4.2%, showing active dip-buying even as Nasdaq recorded a fourth consecutive weekly decline; this is the strongest contradiction to the bearish read (https://www.reuters.com/business/nasdaq-futures-rise-after-steep-ai-selloff-chip-stocks-stabilize-2026-11-06).
  • The Nasdaq had entered correction territory during the Nov. 5 technology selloff, supporting structural vulnerability without proving further overnight downside (https://www.reuters.com/business/sp-500-futures-steady-after-midterm-rally-nasdaq-lags-chip-weakness-2026-11-05).
  • Friday driver performance was mixed but squeeze-prone: NVDA gained 2.7753% and TSLA 4.2276%, while MSFT lost 0.9927% and AAPL lost 0.523%; quotes are from Nov. 6 and are supplemental, not directional overrides.
Sources & evidence dates · 26
  1. BLS confirms October CPI and real earnings are scheduled for Tuesday, November 10, 2026 at 08:30 ET, and October PPI for Friday, November 13 at 08:30 ET.2026-11-03
  2. bls.gov2026-11-06T08:30:00-05:00
  3. reuters.com2026-11-06
  4. Friday price action supplied a counter-signal to the bearish MNQ/MES thesis: Reuters reported the Nasdaq rose 1.1%, the S&P 500 rose 0.31%, and semiconductors rallied 4.2% on November 6. The Nasdaq nevertheless recorded a fourth consecutive weekly decline, so the rebound did not by itself repair the larger bearish structure.2026-11-06
  5. reuters.com2026-11-05
  6. The FRED page confirms DFII10 is the daily 10-year inflation-indexed Treasury yield series sourced from the Federal Reserve, but the fetched page did not expose the claimed 2.60% value for November 5. That number cannot be treated as current without a directly retrieved observation.
  7. Treasury's November TBAC report confirms two-year and ten-year yields had risen roughly 50 and 40 basis points since August, respectively, amid stronger activity, energy disruption and tighter policy expectations. It also says recent Treasury auctions remained generally resilient and found no persistent deterioration in auction demand, contradicting any implication that financing stress had already become an auction-demand crisis.2026-11-04
  8. treasurydirect.gov
  9. tradingview.com2026-11-06
  10. Yahoo2026-11-08T21:52:00.000Z
  11. Yahoo2026-11-08T21:38:00.000Z
  12. Yahoo2026-11-08T21:30:35.000Z
  13. Yahoo2026-11-08T20:59:04.000Z
  14. Yahoo2026-11-08T19:54:08.000Z
  15. Yahoo2026-11-08T19:50:00.000Z
  16. Yahoo2026-11-08T19:44:00.000Z
  17. Yahoo2026-11-08T21:10:17.000Z
  18. Yahoo2026-11-08T20:52:00.000Z
  19. Yahoo2026-11-08T18:05:00.000Z
  20. Yahoo2026-11-08T16:20:41.000Z
  21. Yahoo2026-11-08T16:15:33.000Z
  22. Yahoo2026-11-08T15:43:02.000Z
  23. Yahoo2026-11-08T19:14:23.000Z
  24. Yahoo2026-11-08T18:55:00.000Z
  25. Yahoo2026-11-08T17:23:00.000Z
ES / MESE-mini / Micro E-mini S&P 500Weekly thesis · INTACT

The Lines in the Sand

7,450Reclaim it and the overnight bear case falls apart.
7,396First trapdoor under Friday's close; bears need it gone.
7,557.75Broken prior-week low the bulls must recapture to flip the week.

The Trap

Late bulls tend to read Friday's green close as a reversal even though the bounce stalled under 7469. Late bears tend to pile in near 7396 just as a stretched, compressed tape is most prone to snap back.

Last price7,404
ADR · 30 sessions101.74 pts
Daily EMA217,661.17REJECT
Reopen gapDOWN · -33 ptsFilled
7,3007,3507,4007,4507,5007,5507,6007,6507,7007,750Mon 9:30close 16:00Tue 9:30close 16:00Wed 9:30close 16:00Thu 9:30close 16:00Fri 9:30close 16:00Prior week low · 7,557.75H1 · EMA21 · ES / MES 7,404Yellow: 09:30 open · dashed gray: 16:00 close (ET)

The Read

Bulls rallied Friday off 7322.25 but could not reclaim 7469, and the last two hours faded from 7437 back to 7404. The S&P finished higher on the day, the cleanest case against the bears, yet price still sits under the broken 7557.75 shelf and the daily average at 7661.17. The tape closed compressed, parked near the low end of the rebound. Clear 7450 and the bears are offside; lose 7396 and then 7377, and the 7322.25 low is back in view.

Yesterday's daily candle · Fri, Nov 6
Open7,359High7,469Low7,322.25Close7,404
bullish · range 146.75 pts
Projected range · next session82 pts7,350 – 7,432

Index drivers

Chip names carried Friday's large caps, with NVDA, AMD, MU, AVGO, META, TSLA and both Alphabet share classes closing higher. MSFT, AAPL, AMZN and BRK.B finished lower, keeping the top of the index split. NVDA reports earnings after the close on Nov. 17.

Market data as of Nov 8, 6:34 PM EST · Weights as of 2026-10-01

Evidence · 13 cited findings

Price action · weekly / daily / H1

  • W45 closed bearish at 7404 after opening 7626, taking the prior-week low at 7557.75 and accepting beneath it; the weekly low was 7322.25.
  • Friday's bullish rebound failed to reclaim 7469 and remained beneath daily EMA21 at 7661.17.
  • The last two Friday H1 bars sold from 7437 to 7400 before a 7404 close, leaving price near the lower end of the rebound.
  • The final H1 close was beneath its approximately 7428.8 EMA21; 7450-7469 is immediate resistance.
  • The bearish scenario requires a close below 7396 and then 7377; a reopen above 7450 invalidates the immediate lean.

Metrics

  • Friday used 1.442 ADR on 1.443 times the 30-session average volume, confirming a high-participation rebound after the prior selloff.
  • The close remained 2.528 ADR below daily EMA21, supporting the downtrend while warning that price is stretched.
  • The final H1 range was 12.5 points against an 18.5-point expansion threshold, indicating compression into the close.

Sentiment & current events

  • October payrolls rose 165,000 with 4.1% unemployment and 0.4% monthly earnings growth; this can pressure equity multiples, but it is an older market snapshot (https://www.bls.gov/news.release/empsit.nr0.htm).
  • October CPI and real earnings are scheduled Tuesday, Nov. 10 at 08:30 ET, outside this overnight forecast (https://www.bls.gov/schedule/2026/11_sched_list.htm).
  • The S&P 500 gained 0.31% Friday while the Nasdaq and semiconductors rallied more strongly, providing the clearest contradiction to bearish continuation (https://www.reuters.com/business/nasdaq-futures-rise-after-steep-ai-selloff-chip-stocks-stabilize-2026-11-06).
  • Friday's large-cap drivers were mixed: NVDA, META, AVGO, both Alphabet classes, MU and AMD rose, while MSFT, AAPL, AMZN and BRK.B fell; these are Nov. 6 quotes and do not override price action.
  • Treasury reported higher yields since August but resilient auctions without persistent demand deterioration (https://home.treasury.gov/news/press-releases/sb0679/).
Sources & evidence dates · 33
  1. BLS confirms October CPI and real earnings are scheduled for Tuesday, November 10, 2026 at 08:30 ET, and October PPI for Friday, November 13 at 08:30 ET.2026-11-03
  2. bls.gov2026-11-06T08:30:00-05:00
  3. reuters.com2026-11-06
  4. Friday price action supplied a counter-signal to the bearish MNQ/MES thesis: Reuters reported the Nasdaq rose 1.1%, the S&P 500 rose 0.31%, and semiconductors rallied 4.2% on November 6. The Nasdaq nevertheless recorded a fourth consecutive weekly decline, so the rebound did not by itself repair the larger bearish structure.2026-11-06
  5. reuters.com2026-11-05
  6. The FRED page confirms DFII10 is the daily 10-year inflation-indexed Treasury yield series sourced from the Federal Reserve, but the fetched page did not expose the claimed 2.60% value for November 5. That number cannot be treated as current without a directly retrieved observation.
  7. Treasury's November TBAC report confirms two-year and ten-year yields had risen roughly 50 and 40 basis points since August, respectively, amid stronger activity, energy disruption and tighter policy expectations. It also says recent Treasury auctions remained generally resilient and found no persistent deterioration in auction demand, contradicting any implication that financing stress had already become an auction-demand crisis.2026-11-04
  8. treasurydirect.gov
  9. tradingview.com2026-11-06
  10. Yahoo2026-11-08T21:52:00.000Z
  11. Yahoo2026-11-08T21:38:00.000Z
  12. Yahoo2026-11-08T21:30:35.000Z
  13. Yahoo2026-11-08T20:59:04.000Z
  14. Yahoo2026-11-08T19:54:08.000Z
  15. Yahoo2026-11-08T19:50:00.000Z
  16. Yahoo2026-11-08T19:44:00.000Z
  17. Yahoo2026-11-08T21:10:17.000Z
  18. Yahoo2026-11-08T20:52:00.000Z
  19. Yahoo2026-11-08T18:05:00.000Z
  20. Yahoo2026-11-08T16:20:41.000Z
  21. Yahoo2026-11-08T16:15:33.000Z
  22. Yahoo2026-11-08T15:43:02.000Z
  23. Yahoo2026-11-08T19:14:23.000Z
  24. Yahoo2026-11-08T18:55:00.000Z
  25. Yahoo2026-11-08T17:23:00.000Z
  26. Yahoo2026-11-08T19:06:26.000Z
  27. Yahoo2026-11-08T18:55:39.000Z
  28. Yahoo2026-11-08T16:29:58.000Z
  29. Yahoo2026-11-08T16:26:39.000Z
  30. SeekingAlpha2026-11-08T11:50:00.000Z
  31. SeekingAlpha2026-11-08T05:56:08.000Z
  32. Yahoo2026-11-08T03:13:22.000Z
GC / MGCGold / Micro GoldWeekly thesis · INTACT

The Lines in the Sand

4,088Hourly close above opens the path back to 4116.4.
4,062Hourly close below exposes Friday's 4032 low.
4,032Friday's low; lose it and the weekly bull case breaks.

The Trap

The trap is treating the weekly breakout as settled inside a dead-quiet range. Both sides get chopped when the 4062 to 4088 box fakes a break before either camp commits.

Last price4,079.8
ADR · 30 sessions80.94 pts
Daily EMA214,087.35LOSS
Reopen gapDOWN · -5.2 ptsFilled
3,9003,9504,0004,0504,1004,150close 13:30Mon 8:20close 13:30Tue 8:20close 13:30Wed 8:20close 13:30Thu 8:20close 13:30Fri 8:20close 13:30Prior week high · 4,097.3Prior week low · 3,879.3H1 · EMA21 · GC / MGC 4,079.8Yellow: 08:20 open · dashed gray: 13:30 close (ET)

The Read

Gold bulls broke above the 4097.3 prior-week high this week, then got turned back hard from 4156. Friday slipped to 4079.8, just under its daily average at 4087.35, and the hourly tape has gone quiet between 4069 and 4088. Central-bank and ETF demand back the bulls; record mine output, softer jewelry demand and rising-yield risk push back. Close above 4088 and 4116.4 reopens; lose 4062 and Friday's 4032 low is exposed, and that low is the floor under the weekly bull case.

Yesterday's daily candle · Fri, Nov 6
Open4,098High4,116.4Low4,032Close4,079.8
bearish · range 84.4 pts
Projected range · next session50 pts4,055 – 4,105
⚠ Flat / choppy conditions likely
Evidence · 13 cited findings

Price action · weekly / daily / H1

  • W45 was bullish from 3889.9 to 4079.8, took the prior-week high at 4097.3 and accepted above it, but closed 76.2 points beneath its 4156 high.
  • Friday closed bearish at 4079.8, just below daily EMA21 at 4087.35, producing a LOSS event but only a 0.093-ADR separation.
  • H1 compressed around its approximately 4076.5 EMA21, with recent trade contained near 4069-4088.
  • A close above 4088 would reopen 4116.4, while a close below 4062 would expose Friday's 4032 low.
  • Neither side has broken, so price action owns a flat direction despite the weekly GREEN context.

Metrics

  • Friday used 1.043 ADR on 1.088 times average volume, a normal-to-elevated session without decisive close-location control.
  • The final H1 range was 9.5 points versus a 23.9-point expansion threshold, supporting a compressed rather than directional state.
  • World Gold Council Q3 data show 321.2 tonnes of central-bank buying and 211.2 tonnes of ETF inflows, offset by record 1070.9-tonne mine output and a 17% year-over-year decline in jewelry consumption (https://www.gold.org/goldhub/research/gold-demand-trends/gold-demand-trends-q3-2026).

Sentiment & current events

  • Strong October employment and 0.4% monthly wage growth can support yields and oppose gold, but the market response is older than the current snapshot (https://www.bls.gov/news.release/empsit.nr0.htm).
  • Tuesday CPI at 08:30 ET is the next verified major inflation event and lies outside the overnight window (https://www.bls.gov/schedule/2026/11_sched_list.htm).
  • Central-bank and ETF demand support the weekly bullish weekly view, while record mine output and weaker jewelry demand oppose a simple bullish interpretation.
  • Treasury reported rising yields since August but resilient auction demand, leaving the rates narrative adverse to gold without evidence of financing panic (https://home.treasury.gov/news/press-releases/sb0679/).
  • No verified Sunday reopen, current real-yield observation, options structure or gold positioning was available.
Sources & evidence dates · 9
  1. BLS confirms October CPI and real earnings are scheduled for Tuesday, November 10, 2026 at 08:30 ET, and October PPI for Friday, November 13 at 08:30 ET.2026-11-03
  2. bls.gov2026-11-06T08:30:00-05:00
  3. reuters.com2026-11-06
  4. gold.org2026-11-03
  5. The FRED page confirms DFII10 is the daily 10-year inflation-indexed Treasury yield series sourced from the Federal Reserve, but the fetched page did not expose the claimed 2.60% value for November 5. That number cannot be treated as current without a directly retrieved observation.
  6. Treasury's November TBAC report confirms two-year and ten-year yields had risen roughly 50 and 40 basis points since August, respectively, amid stronger activity, energy disruption and tighter policy expectations. It also says recent Treasury auctions remained generally resilient and found no persistent deterioration in auction demand, contradicting any implication that financing stress had already become an auction-demand crisis.2026-11-04
  7. treasurydirect.gov
  8. tradingview.com2026-11-06
CL / MCLWTI Crude Oil / Micro WTI Crude OilWeekly thesis · INTACT

The Lines in the Sand

89.07Bottom of the base; a break puts 86.61 back in play.
92.55Top of the base; clearing it leaves late shorts offside.
95.34Weekly bear case only breaks above here, near the daily average.

The Trap

After a flush this deep, late shorts tend to pile in at the bottom of the box just as the tape coils. Bottom-pickers lean on tight inventories even though price has not reclaimed a single broken level.

Last price90.37
ADR · 30 sessions4.07 pts
Daily EMA2195.36REJECT
Reopen gapUP · 0.45 ptsFilled
86889092949698100102104106close 14:30Mon 9:00close 14:30Tue 9:00close 14:30Wed 9:00close 14:30Thu 9:00close 14:30Fri 9:00close 14:30Prior week high · 104.99Prior week low · 99.44H1 · EMA21 · CL / MCL 90.37Yellow: 09:00 open · dashed gray: 14:30 close (ET)

The Read

Crude bears flushed price from 102.41 to 86.61 this week, and bulls have since dug in with a base between 89.07 and 92.55. Friday closed at 90.37, right in the middle of that box, with the hourly range squeezed tight. Crude and distillate draws point to a tight physical market, the strongest argument against the bears, but price still sits well below the broken 99.44 shelf and the daily average at 95.36. Break 89.07 and 86.61 is back on the table; clear 92.55 and the 95-96 area opens up.

Yesterday's daily candle · Fri, Nov 6
Open91.19High92.55Low89.07Close90.37
bearish · range 3.48 pts
Projected range · next session1.8 pts89.4 – 91.2
⚠ Flat / choppy conditions likely
Evidence · 14 cited findings

Price action · weekly / daily / H1

  • W45 fell from 102.41 to 90.37, reached 86.61 and accepted beneath the prior-week low at 99.44, preserving a strongly bearish weekly structure.
  • Since the 86.61 low, price has based inside roughly 89-92.55 and Friday closed at 90.37 within that range.
  • Friday's daily candle was bearish, but its 0.2356 body ratio and close near the approximately 90.51 H1 EMA21 show equilibrium after the flush.
  • A break below 89.07 would reopen 86.61, while a break above 92.55 would expose the 95-96 area.
  • Neither boundary has broken, so price action owns a flat overnight direction within weekly RED context.

Metrics

  • Friday used 0.855 ADR and volume was 1.508 times its 30-session average, showing active two-way trade rather than a decisive close.
  • The close remained 1.226 ADR below daily EMA21 at 95.36, preserving bearish higher-timeframe pressure.
  • The final H1 range was 0.32 against a 0.82 expansion threshold, indicating compression.
  • EIA reported crude stocks down 0.9 million barrels, distillates down 3.6 million, 94.5% refinery utilization and four-week product supplied up 4.2% year over year, supporting physical tightness without establishing direction (https://www.eia.gov/petroleum/supply/weekly/archive/2026/2026_11_04/download/summary.txt).

Sentiment & current events

  • Physical inventory data support crude, while the 12% weekly price decline and acceptance below 99.44 oppose that fundamental signal.
  • The cited WTI curve evidence used Oct. 30 settlements and expired before this forecast, so it is excluded from direction.
  • No fresh primary confirmation was obtained for rig counts, export flows, geopolitical vessel data or current managed-money positioning.
  • Tuesday CPI and Friday PPI can affect the dollar and growth expectations but fall outside the overnight window (https://www.bls.gov/schedule/2026/11_sched_list.htm).
  • No verified Sunday reopen or current exchange settlement curve was available.
Sources & evidence dates · 5
  1. BLS confirms October CPI and real earnings are scheduled for Tuesday, November 10, 2026 at 08:30 ET, and October PPI for Friday, November 13 at 08:30 ET.2026-11-03
  2. EIA confirms that, for the week ended October 30, commercial crude inventories fell 0.9 million barrels to 409.8 million, 4% below the five-year average; distillates fell 3.6 million and were 13% below average; refinery utilization was 94.5%; and four-week total product supplied was 21.2 million b/d, up 4.2% year over year. These metrics support near-term physical tightness but do not independently establish an MCL price direction.2026-11-04
  3. commoditynews.morgandowney.com2026-10-31
  4. tradingview.com2026-11-06

Free. Always. Futures trading edge in your inbox.

You're in. Watch your inbox.

We do not send junk mail. We do not spam.