Session Prep

Two minutes tonight. A plan tomorrow.
Evening edition · Data as of Thu, Nov 5, 5:00 PM EST · All times Eastern
Deep research

Tonight's one thing

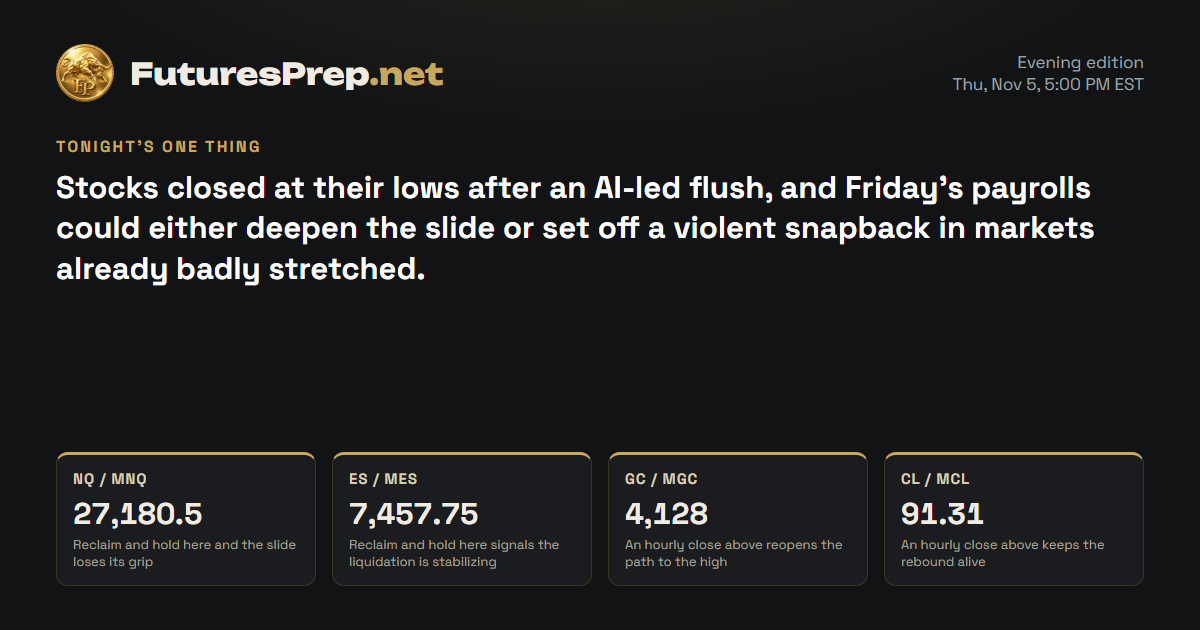
Stocks closed at their lows after an AI-led flush, and Friday's payrolls could either deepen the slide or set off a violent snapback in markets already badly stretched.

Tomorrow's market movers · Friday, November 6

Time ETImpactEventForecastPrevious
8:30 AMHighAverage Hourly Earnings m/m0.3%0.1%
8:30 AMHighNon-Farm Employment Change65K29K
8:30 AMHighUnemployment Rate4.2%4.2%
10:00 AMMediumPrelim UoM Consumer Sentiment48.146.3
10:00 AMMediumPrelim UoM Inflation Expectations—4.7%

U.S. releases, high and medium impact.

NQ / MNQE-mini / Micro E-mini Nasdaq-100Weekly thesis · FULFILLED

The Lines in the Sand

27,180.5Reclaim and hold here and the slide loses its grip
26,920First stop-gap for a squeeze off stretched lows
26,571.75The weekly floor, sitting barely under the close

The Trap

After a flush this hard, late shorts tend to pile in at the lows right when the market is most stretched, and a quick pop toward 26920 shakes them out. Bounce hunters get caught the other way, treating that pop as the bottom while price is still under 27180.50.

Last price26,600.5
ADR · 30 sessions629.49 pts
Daily EMA2129,214.95REJECT
Reopen gapUP · 34.5 ptsFilled
26,50027,00027,50028,00028,50029,00029,500Fri 9:30Mon 9:30close 16:00Tue 9:30close 16:00Wed 9:30close 16:00Thu 9:30close 16:00Prior week low · 28,232.25H1 · EMA21 · NQ / MNQ 26,600.5Yellow: 09:30 open · dashed gray: 16:00 close (ET)

The Read

Sellers ran the table today: MNQ dropped from 28663.75 and closed at 26600.50, a hair above the 26571.75 low. Dip buyers who leaned on the prior-week low at 28232.25 are now offside, and the hourly chart stayed pinned under a falling average into the close. The weight of the tape points lower, with chip names leading broad liquidation. The counter-argument is the stretch: price sits far below its daily trend average at 29214.95, and stretched markets can snap back hard, especially into Friday payrolls. Stay under 27180.50 and the floor at 26571.75 stays exposed; reclaim and hold above 27180.50 and the slide starts to lose its grip.

Yesterday's daily candle · Thu, Nov 5
Open28,663.75High28,668.75Low26,571.75Close26,600.5
bearish · range 2,097 pts
Projected range · next session860 pts26,180 – 27,040

Index drivers

The heavyweights fell together: NVIDIA, Broadcom and Tesla took the deepest hits, while Microsoft, Meta, Amazon, Alphabet and Apple all closed lower. No single stock carried the drop; the damage was synchronized across mega-caps and chips. NVIDIA is the next big name on the calendar, with earnings scheduled for November 17 after the close.

Market data as of Nov 5, 6:34 PM EST · Weights as of 2026-09-30

Evidence · 9 cited findings

Price action · weekly / daily / H1

  • Weekly structure is decisively bearish: MNQ accepted below the prior-week low at 28232.25 and finished near the 26571.75 weekly low after falling 1970 points from the weekly open.
  • H1 remained below a rapidly falling EMA21 and ended near the session low in fresh expansion; the projected path allows a rebound toward 26920 before another test below 26571.75.
  • Immediate downside continuation weakens only with sustained acceptance above 27180.50; severe extension is the strongest contradiction because it raises mechanical-rebound risk.

Metrics

  • Daily close 26600.50 versus EMA21 29214.95, with the EMA classified as a rejection.
  • Weekly acceptance below 28232.25 confirms the prior-week-low breakdown; the open 29217.75 gap remains unfilled overhead.
  • The latest completed H1 range was 180.75 points versus a 105-point expansion threshold.

Sentiment & current events

  • Contemporaneous reporting corroborated an AI- and semiconductor-led equity liquidation, supporting the bearish tape (https://www.foxbusiness.com/markets/stocks-nov-5-2026).
  • The October 28 FOMC held rates at 3.75%-4.00%, described activity as strong and inflation as elevated, and recorded two dissents favoring a hike (https://www.federalreserve.gov/newsevents/pressreleases/monetary20261028a.htm).
  • The strongest contradiction is panic-like extension ahead of payrolls, which can produce a sharp rebound without establishing a durable reversal.
Sources & evidence dates · 24
  1. bls.gov2026-11-03
  2. bls.gov2026-10-14
  3. bea.gov2026-10-29
  4. The October 28 FOMC maintained the federal-funds target range at 3.75%-4.00%, described activity as strong and inflation as elevated, and recorded two dissents favoring a 25-basis-point increase.2026-10-28
  5. federalreserve.gov
  6. home.treasury.gov2026-11-04
  7. foxbusiness.com2026-11-05T16:43:00-05:00
  8. cmegroup.com
  9. Retail Reddit commentary showed fear, distrust, and bull-trap language, but S4 discussion cannot establish direction, capitulation, coordinated activity, or reversal probability.2026-11-04
  10. Yahoo2026-11-05T21:49:45.000Z
  11. Yahoo2026-11-05T21:42:50.000Z
  12. Yahoo2026-11-05T21:40:00.000Z
  13. Yahoo2026-11-05T21:28:50.000Z
  14. Yahoo2026-11-05T21:25:56.000Z
  15. Yahoo2026-11-05T21:25:00.000Z
  16. Yahoo2026-11-05T21:12:47.000Z
  17. Yahoo2026-11-05T21:06:53.000Z
  18. Yahoo2026-11-05T21:39:01.000Z
  19. Yahoo2026-11-05T21:30:00.000Z
  20. Yahoo2026-11-05T20:27:00.000Z
  21. Yahoo2026-11-05T21:21:11.000Z
  22. Yahoo2026-11-05T20:03:21.000Z
  23. Yahoo2026-11-05T21:38:01.000Z
  24. Yahoo2026-11-05T21:03:35.000Z
ES / MESE-mini / Micro E-mini S&P 500Weekly thesis · FULFILLED

The Lines in the Sand

7,457.75Reclaim and hold here signals the liquidation is stabilizing
7,405Where a relief bounce runs into its first test
7,345Weekly low, just eight points under the close

The Trap

Late shorts tend to press at the lows of a stretched slide and get squeezed on a quick rebound toward 7405. Bounce hunters get caught the other way, treating that pop as the bottom while price is still below 7457.75.

Last price7,353
ADR · 30 sessions99.08 pts
Daily EMA217,687.02LOSS
Reopen gapUP · 6 ptsFilled
7,3507,4007,4507,5007,5507,6007,6507,7007,750Fri 9:30Mon 9:30close 16:00Tue 9:30close 16:00Wed 9:30close 16:00Thu 9:30close 16:00Prior week low · 7,557.75H1 · EMA21 · ES / MES 7,353Yellow: 09:30 open · dashed gray: 16:00 close (ET)

The Read

Sellers owned the session: MES opened at 7736.25 and closed at 7353, just eight points above the 7345 weekly low. Buyers who defended the prior-week low at 7557.75 are now offside, and the hourly chart kept printing lower highs and lower lows under a falling average. The weight of evidence points down, but the counter-argument is the stretch: price sits far below its daily trend average at 7687.02, and payrolls at 08:30 ET Friday could light a fast bounce. Stay under 7457.75 and the 7345 floor remains in play; reclaim and hold above 7457.75 and the liquidation starts to look like it is finding a base.

Yesterday's daily candle · Thu, Nov 5
Open7,736.25High7,738.75Low7,345Close7,353
bearish · range 393.75 pts
Projected range · next session158 pts7,270 – 7,428

Index drivers

Chip stocks led the damage: Micron and AMD took the heaviest losses, with NVIDIA and Broadcom close behind. Microsoft, Meta, Amazon, Alphabet, Apple and Berkshire Hathaway also closed lower, showing broad weakness rather than one bad name. NVIDIA has earnings scheduled for November 17 after the close.

Market data as of Nov 5, 6:34 PM EST · Weights as of 2026-10-01

Evidence · 13 cited findings

Price action · weekly / daily / H1

  • Weekly price accepted below the prior-week low at 7557.75 and closed only eight points above the 7345 weekly low inside a strongly red weekly candle.
  • The daily session lost EMA21 with a 0.9733 body-ratio decline, 2.12 times average volume, and a 3.974-ADR range.
  • H1 ended in renewed expansion below its falling EMA21 after successive lower highs and lows; the projected path allows a rebound toward 7405 before another break attempt.
  • A recovery accepted above 7457.75 would be the first evidence that liquidation is stabilizing; severe extension and rebound risk are the strongest contradiction.

Metrics

  • Daily close 7353.00 versus EMA21 7687.02, with price 3.371 ADR below the average.
  • The latest completed H1 range was 37.75 points versus an 18.5-point expansion threshold.
  • Weekly acceptance below 7557.75 confirms breakdown structure with one session remaining.
  • Supplied index-driver quotes show synchronized weakness in NVDA, MSFT, META, AVGO, MU, and AMD; weights are dated and supplemental (https://www.ssga.com/us/en/intermediary/etfs/state-street-spdr-sp-500-etf-trust-spy).

Sentiment & current events

  • Contemporaneous reporting corroborated a severe equity selloff led by AI and semiconductor names (https://www.foxbusiness.com/markets/stocks-nov-5-2026).
  • The October Employment Situation is scheduled for 08:30 ET Friday; timing is verified but the outcome and supplied prior payroll figures are not (https://www.bls.gov/schedule/2026/11_sched_list.htm).
  • The FOMC held rates at 3.75%-4.00%, called activity strong and inflation elevated, and recorded two dissents favoring a hike (https://www.federalreserve.gov/newsevents/pressreleases/monetary20261028a.htm).
  • Q3 annualized PCE measures of 2.1% headline and 2.5% core complicate a uniformly hawkish macro narrative (https://www.bea.gov/news/2026/gdp-advance-estimate-3rd-quarter-2026).
  • Panic-like extension raises mechanical-bounce risk, but fear alone is not reversal evidence.
Sources & evidence dates · 30
  1. bls.gov2026-11-03
  2. bls.gov2026-10-14
  3. bea.gov2026-10-29
  4. The October 28 FOMC maintained the federal-funds target range at 3.75%-4.00%, described activity as strong and inflation as elevated, and recorded two dissents favoring a 25-basis-point increase.2026-10-28
  5. federalreserve.gov
  6. home.treasury.gov2026-11-04
  7. foxbusiness.com2026-11-05T16:43:00-05:00
  8. cmegroup.com
  9. Retail Reddit commentary showed fear, distrust, and bull-trap language, but S4 discussion cannot establish direction, capitulation, coordinated activity, or reversal probability.2026-11-04
  10. Yahoo2026-11-05T21:49:45.000Z
  11. Yahoo2026-11-05T21:42:50.000Z
  12. Yahoo2026-11-05T21:40:00.000Z
  13. Yahoo2026-11-05T21:28:50.000Z
  14. Yahoo2026-11-05T21:25:56.000Z
  15. Yahoo2026-11-05T21:25:00.000Z
  16. Yahoo2026-11-05T21:12:47.000Z
  17. Yahoo2026-11-05T21:06:53.000Z
  18. Yahoo2026-11-05T21:39:01.000Z
  19. Yahoo2026-11-05T21:30:00.000Z
  20. Yahoo2026-11-05T20:27:00.000Z
  21. Yahoo2026-11-05T21:21:11.000Z
  22. Yahoo2026-11-05T20:03:21.000Z
  23. Yahoo2026-11-05T21:38:01.000Z
  24. Yahoo2026-11-05T21:03:35.000Z
  25. Yahoo2026-11-05T21:32:40.000Z
  26. Yahoo2026-11-05T21:30:00.000Z
  27. Yahoo2026-11-05T20:39:00.000Z
  28. Yahoo2026-11-05T07:50:00.000Z
  29. SeekingAlpha2026-11-05T02:52:29.000Z
  30. Yahoo2026-11-05T02:20:46.000Z
GC / MGCGold / Micro GoldWeekly thesis · INVALIDATED

The Lines in the Sand

4,128An hourly close above reopens the path to the high
4,067.1Lose this and the breakout is in trouble
4,156The weekly high where sellers slapped the rally back

The Trap

After a breakout above the old weekly high, late chasers tend to pile in near 4156 right as the rally stalls, then get shaken out on the pullback. Shorts who fade every dip get caught when the 4067.10 area holds and price grinds back up.

Last price4,098.1
ADR · 30 sessions80.21 pts
Daily EMA214,088.83RECLAIM
Reopen gapNo opening gap
3,9003,9504,0004,0504,1004,150close 13:30Fri 8:20close 13:30Mon 8:20close 13:30Tue 8:20close 13:30Wed 8:20close 13:30Thu 8:20close 13:30Prior week high · 4,097.3Prior week low · 3,879.3H1 · EMA21 · GC / MGC 4,098.1Yellow: 08:20 open · dashed gray: 13:30 close (ET)

The Read

Buyers took control of the week: gold climbed from 3889.90, pushed through the prior-week high at 4097.30 and tagged 4156 before sellers knocked it back. The daily candle reclaimed its trend average at 4088.83 on heavy volume, but the long upper wick shows a real two-way fight. The fuel is softer yields and a weaker dollar plus steady central-bank demand; the counter-argument is weaker jewellery and bar-and-coin demand alongside record mine supply. Hourly momentum cooled and closed under its average, so a dip toward 4067.10 is on the table, and payrolls at 08:30 ET could jolt yields either way. Hold 4067.10 and close an hour above 4128 and the door to 4156 reopens; lose 4067.10 and the breakout starts to crack.

Yesterday's daily candle · Thu, Nov 5
Open4,075High4,156Low4,067.1Close4,098.1
bullish · range 88.9 pts
Projected range · next session106 pts4,062 – 4,168
Evidence · 12 cited findings

Price action · weekly / daily / H1

  • Weekly structure is bullish after taking and accepting above the prior-week high at 4097.30 while never breaching the prior-week low.
  • The daily candle reclaimed EMA21 at 4088.83 on 1.465 times average volume, but its 0.2598 body ratio and rejection from 4156 show substantial two-way trade.
  • H1 momentum cooled for four bars without expansion and the latest close was below H1 EMA21, leaving pullback risk toward 4067.10.
  • Holding the daily EMA region and later closing above 4128 would favor another attempt at 4156; failure below 4067.10 would materially weaken the bullish scenario.

Metrics

  • Weekly open 3889.90 versus current close 4098.10 represents a 208.20-point gain.
  • The daily range was 88.90 points, or 1.108 ADR, with the close 0.116 ADR above daily EMA21.
  • The latest H1 range was 18.4 points versus a 23.9-point expansion threshold, so immediate expansion was absent.
  • The prior bearish weekly view is invalidated: price accepted above the prior-week high and through its 4033.30 invalidation level.

Sentiment & current events

  • World Gold Council data showed 321 tonnes of Q3 central-bank buying and 211 tonnes of ETF inflows, supporting structural demand (https://www.gold.org/goldhub/research/gold-demand-trends/gold-demand-trends-q3-2026).
  • The strongest contradiction is mixed demand and supply: bar-and-coin demand fell 19%, jewellery consumption fell 17%, and mine production reached a record 1071 tonnes (https://www.gold.org/goldhub/research/gold-demand-trends/gold-demand-trends-q3-2026).
  • The 08:30 ET Employment Situation can sharply alter yields and the dollar before the projected next session (https://www.bls.gov/schedule/2026/11_sched_list.htm).
  • Iran-related maritime sanctions are verified, but any resulting safe-haven effect remains conditional (https://home.treasury.gov/news/press-releases/sb0681).
Sources & evidence dates · 9
  1. bls.gov2026-11-03
  2. bls.gov2026-10-14
  3. bea.gov2026-10-29
  4. The October 28 FOMC maintained the federal-funds target range at 3.75%-4.00%, described activity as strong and inflation as elevated, and recorded two dissents favoring a 25-basis-point increase.2026-10-28
  5. federalreserve.gov
  6. gold.org2026-11-03
  7. home.treasury.gov2026-11-04
  8. cnbc.com2026-11-05
  9. cmegroup.com
CL / MCLWTI Crude Oil / Micro WTI Crude OilWeekly thesis · INVALIDATED

The Lines in the Sand

91.31An hourly close above keeps the rebound alive
89.88Close below and the bounce loses its footing
95.83Daily trend average overhead, the big ceiling

The Trap

Shorts who rode the slide from above 99.44 tend to stay too long and get squeezed when a bounce like this catches fire. Bounce chasers face the opposite risk, mistaking a rebound under 95.83 for a trend change.

Last price91.19
ADR · 30 sessions4.07 pts
Daily EMA2195.83REJECT
Reopen gapNo opening gap
86889092949698100102104106close 14:30Fri 9:00close 14:30Mon 9:00close 14:30Tue 9:00close 14:30Wed 9:00close 14:30Thu 9:00close 14:30Prior week high · 104.99Prior week low · 99.44H1 · EMA21 · CL / MCL 91.19Yellow: 09:00 open · dashed gray: 14:30 close (ET)

The Read

Sellers dominated the week, dragging crude from 102.41 to an 86.61 low, but buyers fought back hard today and closed at 91.19, right near the 91.31 high. The bounce came on heavy volume with higher hourly lows, backed by falling inventories and busy refineries. The counter-argument is big: record domestic production, a deeply red weekly candle, and the daily trend average sitting overhead at 95.83. This is a rebound inside a downtrend, not a repaired chart, and unresolved Hormuz risk can swing it either way. An hourly close above 91.31 opens room for more; a close below 89.88 and the bounce loses its footing.

Yesterday's daily candle · Thu, Nov 5
Open88.03High91.31Low86.61Close91.19
bullish · range 4.7 pts
Projected range · next session3.3 pts89.75 – 93.05
Evidence · 13 cited findings

Price action · weekly / daily / H1

  • Weekly structure remains bearish after accepted trade below the prior-week low at 99.44, and the large red weekly body is unlikely to be erased in the final session.
  • The completed daily candle formed a 3.16-point bullish body from the 86.61 low on 1.807 times average volume, demonstrating responsive demand.
  • Price remains 1.143 ADR below daily EMA21 at 95.83, leaving the rebound beneath major trend resistance.
  • H1 formed higher lows and higher closes from 86.61, reclaimed H1 EMA21, and ended in fresh expansion near 91.31; a close below 89.88 would undermine the rebound.

Metrics

  • Daily open 88.03, high 91.31, low 86.61, and close 91.19 produced a 1.156-ADR range.
  • The latest H1 range was 0.86 versus a 0.82 expansion threshold.
  • The weekly candle remains red from 102.41 to 91.19 after taking and accepting below 99.44.
  • The prior flat weekly thesis is invalidated, and its 99.25-100.25 overshoot framework no longer describes current structure.

Sentiment & current events

  • Current reporting describes WTI rebounding above $90 after falling near $87 as markets alternated between de-escalation expectations and unresolved Hormuz risk (https://www.bloomberg.com/news/articles/2026-11-04/latest-oil-market-news-and-analysis-for-nov-5).
  • EIA reported crude inventories down 0.9 million barrels, distillates down 3.6 million, refinery utilization at 94.5%, and four-week product supplied 4.2% above a year earlier, supporting prompt tightness (https://www.eia.gov/petroleum/supply/weekly/archive/2026/2026_11_04/download/summary.txt).
  • The strongest contradiction is record-high domestic production of 14.003 million barrels per day, which offsets inventory and demand support (https://www.eia.gov/petroleum/supply/weekly/archive/2026/2026_11_04/download/summary.txt).
  • Treasury sanctions against an Iran-linked maritime-fraud network are verified, but any effect on flows or prices remains conditional (https://home.treasury.gov/news/press-releases/sb0681).
  • Payrolls may move the dollar and broad risk appetite at 08:30 ET, but its direct crude effect is uncertain (https://www.bls.gov/schedule/2026/11_sched_list.htm).
Sources & evidence dates · 9
  1. bls.gov2026-11-03
  2. bls.gov2026-10-14
  3. bea.gov2026-10-29
  4. The October 28 FOMC maintained the federal-funds target range at 3.75%-4.00%, described activity as strong and inflation as elevated, and recorded two dissents favoring a 25-basis-point increase.2026-10-28
  5. federalreserve.gov
  6. EIA reported that commercial crude inventories fell 0.9 million barrels to 409.8 million, distillates fell 3.6 million to 99.3 million, refinery utilization reached 94.5%, four-week product supplied averaged 21.2 million b/d and was 4.2% above a year earlier, and domestic crude production was 14.003 million b/d. These data support prompt-product tightness, while record-high production is a bearish offset.2026-11-04
  7. home.treasury.gov2026-11-04
  8. bloomberg.com2026-11-04
  9. cmegroup.com

Free. Always. Futures trading edge in your inbox.

You're in. Watch your inbox.

We do not send junk mail. We do not spam.