The Lines in the Sand
The Trap
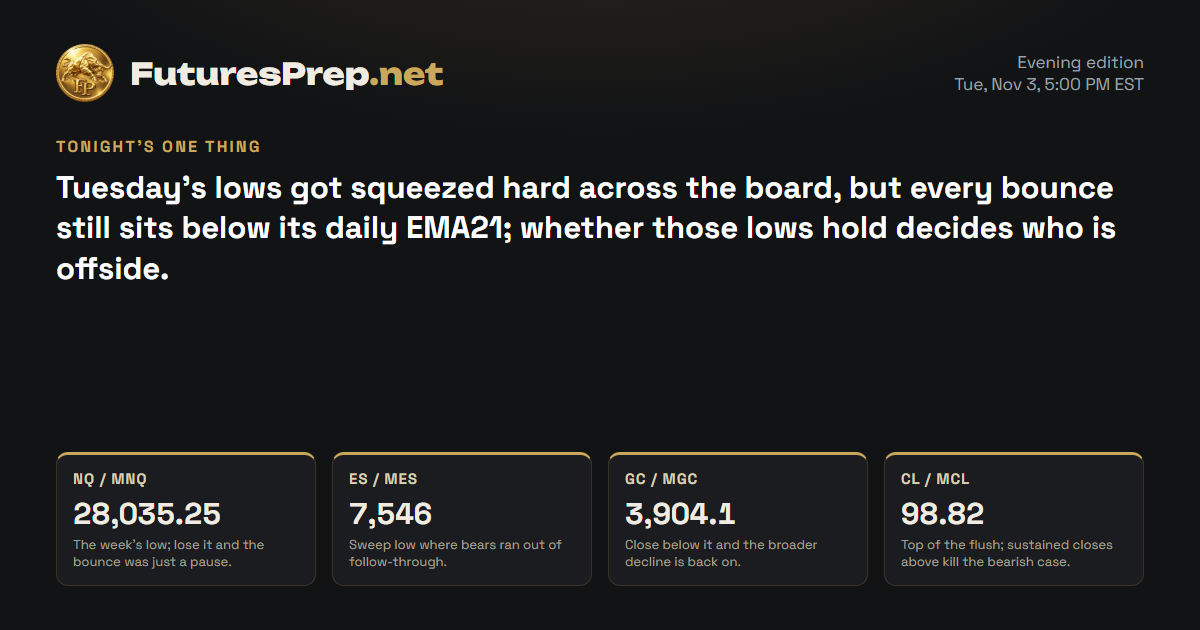
Late shorts who pressed the break toward 28035.25 got squeezed when big tech ripped into the close. The mirror trap is longs treating a countertrend bounce, still far below the daily average, like a finished turn.
The Read
Bears owned the week, broke the 28232.25 prior-week low and drove price down to 28035.25, then got caught leaning as Tuesday closed at 28416.75. The bounce has teeth: heavyweights closed strong and the hourly chart reclaimed its average with a big final bar. But the week is still red under its 28587 open, and price sits far beneath the daily EMA21 at 29562.56. The strongest counter-argument is plain: price already climbed back above the very level bears broke. Hold above 28232.25 and the squeeze can stretch toward 28891.50; lose 28035.25 and the floor is gone.
Index drivers
| Ticker | Approx. weight | Day move | Next earnings | Top headline |
|---|---|---|---|---|
| NVDA | 8.4% | +2.29% | Nov 17 · After close | Cinemark Holdings, Inc. Q3 2026 Earnings Call Summary |
| MSFT | 5.75% | +2.74% | — | Do You Know How Much of Your 401(k) Is Riding on the AI Trade Voters Want Paused? |
| AAPL | 7.28% | −1.9% | — | US Equity Markets Mixed Ahead of US Midterm Election Results |
| AMZN | 4.04% | +2.06% | — | Do You Know How Much of Your 401(k) Is Riding on the AI Trade Voters Want Paused? |
| META | 3.26% | +2.36% | — | Do You Know How Much of Your 401(k) Is Riding on the AI Trade Voters Want Paused? |
| AVGO | 2.47% | +3.07% | — | AMD Changes the Mood With Big Earnings Beat |
| GOOGL | 3% | +0.37% | — | Do You Know How Much of Your 401(k) Is Riding on the AI Trade Voters Want Paused? |
| TSLA | 2.81% | −1.32% | — | Stock Market Election Night Live Coverage: Dow Futures, AI Stocks, Elon Musk In Focus; AMD, Arista, Amgen, Astera Move On Earnings |
NVDA, MSFT, AMZN, META and AVGO all closed higher Tuesday, while GOOGL edged up. AAPL and TSLA closed lower, leaving the leadership split rather than unanimous. NVDA reports earnings on November 17 after the close.
Market data as of Nov 3, 6:33 PM EST · Weights as of 2026-09-30
Evidence · 9 cited findings
Price action · weekly / daily / H1
- Weekly structure remains bearish: price accepted below the 28232.25 prior-week low, the forming week is red beneath its 28587 open, and the 28035.25 low preserves continuation risk despite Tuesday's rebound.
- Tuesday formed a bullish recovery candle from 28035.25 and closed at 28416.75, but price remains 2.10 ADR below the daily EMA21 at 29562.56; the recovery remains countertrend below 28891.50 and 29217.75.
- H1 recovered above its local EMA21 and ended with a 178.25-point expansion bar, supporting an initial squeeze toward 28550-28650 before the projected downside rotation.
- A close below 28270 during 09:00-11:00 ET would activate the downside expansion scenario; failure to hold 28035.25 would reinforce the dominant weekly decline.
Metrics
- The 414.50-point daily range used 76.1% of the 544.66 ADR, leaving room for another meaningful move during the forecast window.
- The daily close is 2.104 ADR below EMA21, while volume was 1.033 times its 30-session average; this supports a damaged higher-timeframe trend but not capitulation.
- Major QQQ drivers were mixed but mostly strong at the 16:00 ET equity close: NVDA +2.29%, MSFT +2.74%, AMZN +2.06%, META +2.36% and AVGO +3.07%, versus AAPL -1.90% and TSLA -1.32% (https://www.invesco.com/qqq-etf/en/about.html).
Sentiment & current events
- Contemporaneous reporting corroborates limited U.S. strikes on Iran's Qeshm Island, adding headline volatility without establishing an equity-index direction (https://www.bbc.com/news/articles/cx240mrm3g8vo).
- AMD reported an earnings beat and stronger AI-driven outlook after the cash close, a supportive technology-sector input, but the source is secondary and does not override MNQ price action (https://finnhub.io/api/news?id=b44643d982cd1a4bebcf71c08b38eafdc2db7bc86a42fdd87bb73e0b895bae5f).
Sources & evidence dates · 23
- bea.gov2026-10-29T08:30:00-04:00
- bea.gov
- home.treasury.gov2026-08-04T00:00:00-04:00
- bbc.com2026-11-03T11:33:00Z
- cftc.gov2026-10-30T15:30:00-04:00
- tradingeconomics.com2026-11-03T14:10:00-05:00
- tradingview.com2026-10-30T00:00:00-04:00
- Yahoo2026-11-03T21:49:52.000Z
- Yahoo2026-11-03T21:49:34.000Z
- Yahoo2026-11-03T21:48:15.000Z
- Yahoo2026-11-03T21:30:00.000Z
- Yahoo2026-11-03T21:19:24.000Z
- Yahoo2026-11-03T21:16:00.000Z
- Yahoo2026-11-03T21:14:37.000Z
- Yahoo2026-11-03T21:33:00.000Z
- Yahoo2026-11-03T21:16:43.000Z
- Yahoo2026-11-03T21:05:00.000Z
- Yahoo2026-11-03T21:05:00.000Z
- Yahoo2026-11-03T21:29:00.000Z
- Yahoo2026-11-03T20:44:31.000Z
- Yahoo2026-11-03T21:00:00.000Z
- Yahoo2026-11-03T18:22:00.000Z