Session Prep

Two minutes tonight. A plan tomorrow.
Evening edition · Data as of Mon, Nov 2, 5:00 PM EST · All times Eastern
Deep research

Tonight's one thing

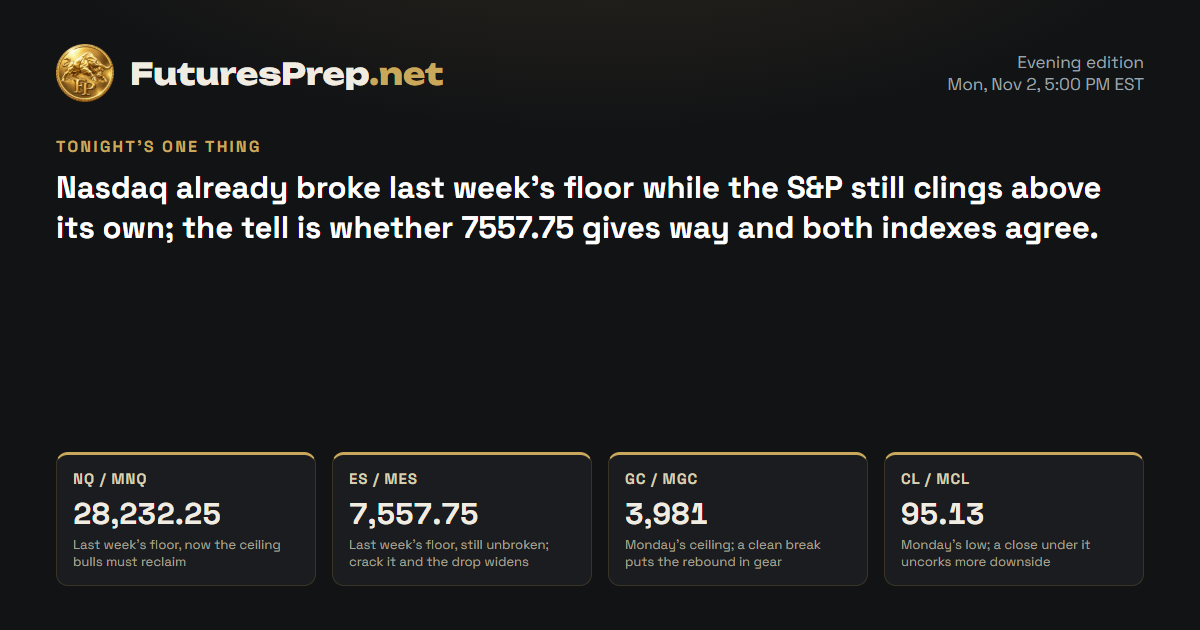
Nasdaq already broke last week's floor while the S&P still clings above its own; the tell is whether 7557.75 gives way and both indexes agree.

Tomorrow's market movers · Tuesday, November 3

Time ETImpactEventForecastPrevious
10:00 AMMediumJOLTS Job Openings7.15M7.08M
10:16 AMHighCongressional Elections——

U.S. releases, high and medium impact.

NQ / MNQE-mini / Micro E-mini Nasdaq-100Weekly thesis · FULFILLED

The Lines in the Sand

28,232.25Last week's floor, now the ceiling bulls must reclaim
28,560Back above here, the breakdown starts to look shaky
28,101.25Monday's low, the next floor bears want to crack

The Trap

After a session this stretched, late shorts tend to pile in right at the lows and get squeezed on a reflex bounce toward 28310. Bulls who grab that bounce get caught too when it stalls under the old floor.

Last price28,226
ADR · 30 sessions544.01 pts
Daily EMA2129,679.89REJECT
Reopen gapDOWN · -25 ptsFilled
28,00028,25028,50028,75029,00029,25029,50029,75030,00030,250Tue 9:30Wed 9:30Thu 9:30Fri 9:30Mon 9:30close 16:00Prior week high · 30,180Prior week low · 28,232.25H1 · EMA21 · NQ / MNQ 28,226Yellow: 09:30 open · dashed gray: 16:00 close (ET)

The Read

Bulls are offside. Bears drove Monday from 28587 straight through last week's 28232.25 low and closed at 28226, after a hard rejection at the 29679.89 daily average on heavier-than-usual volume. The tape clearly tilts lower, but the counterpunch is real: the day was badly stretched, and the last hour bounced off 28136.5, so a relief pop toward 28440-28560 would fit the picture. Tuesday's JOLTS report lands into that tension. Stay pinned under 28232.25 and the door opens toward 28080-27920; get back above 28560 and the breakdown loses its teeth.

Yesterday's daily candle · Mon, Nov 2
Open28,587High28,891.5Low28,101.25Close28,226
bearish · range 790.25 pts
Projected range · next session545 pts27,920 – 28,465

Index drivers

Microsoft led the heavyweights lower, with Nvidia, Apple, Meta and Broadcom also closing in the red. Amazon and Tesla finished higher, the only real counterweights in the group. None of the tracked heavyweights had a scheduled earnings date listed, and headlines framed the day as an AI-led tech slide.

Market data as of Nov 2, 6:32 PM EST · Weights as of 2026-09-30

Evidence · 10 cited findings

Price action · weekly / daily / H1

  • Weekly price accepted below the 28232.25 prior-week low and closed Monday at 28226 after opening at 28587, confirming structural downside continuation unless the broken boundary is reclaimed.
  • Monday produced a 1.453-ADR bearish range, rejected the 29679.89 daily EMA21 and closed below it on 1.255 times the 30-day average volume.
  • H1 remained deeply below its EMA21 after sequential afternoon expansion; the final bar rebounded from 28136.5, leaving room for a corrective bounce before renewed pressure.
  • The projected path allows a rebound toward 28310 and potentially 28440-28560, but expects failure and renewed pressure toward 28080-27920.

Metrics

  • Monday's 790.25-point range used 1.453 ADR, so downside structure is strong but short-term rebound risk is elevated after an already extended session.
  • The last completed H1 range was 130.25 points versus a 105-point expansion threshold and was still expanding at the 16:00 ET close.
  • The daily close was 2.673 ADR below the 29679.89 EMA21, reinforcing trend pressure while also documenting substantial extension.

Sentiment & current events

  • A contemporaneous headline described an AI-led technology selloff, consistent with the bearish index tape but not independently sufficient to establish direction. Source: https://finnhub.io/api/news?id=40ce51a9480bbed184e2d3240be76aa83bb6449420d848b314d2690b3d90fc47
  • No scheduled FOMC decision falls during November 3-6; the prior meeting was October 27-28 and the next is December 8-9. Source: https://www.federalreserve.gov/monetarypolicy/fomccalendars.htm
  • Treasury refunding details are scheduled for November 4 at 08:30 ET, but maturity composition and auction sizes—not the borrowing headline alone—will determine market impact. Source: https://home.treasury.gov/news/press-releases/sb0675
Sources & evidence dates · 27
  1. BLS officially schedules September 2026 JOLTS for Nov. 3 at 10:00 a.m. ET, preliminary Q3 productivity and costs for Nov. 5 at 8:30 a.m. ET, and the October Employment Situation for Nov. 6 at 8:30 a.m. ET.2026-02-18
  2. bls.gov2026-02-18
  3. The official Federal Reserve calendar confirms that the FOMC met Oct. 27-28, 2026 and next meets Dec. 8-9, so no scheduled FOMC decision falls within Nov. 3-6.2026-10-28
  4. federalreserve.gov2026-10-28
  5. Treasury officially projects $618 billion of privately held net marketable borrowing for Oct.-Dec. 2026 and $800 billion for Jan.-Mar. 2027, with quarterly-refunding details scheduled for Nov. 4 at 8:30 a.m. ET.2026-11-02
  6. 2026-11-02
  7. bls.gov2026-02-18
  8. tradingview.com2026-11-02
  9. Yahoo2026-11-02T21:47:39.000Z
  10. Yahoo2026-11-02T21:45:04.000Z
  11. Yahoo2026-11-02T21:44:55.000Z
  12. Yahoo2026-11-02T21:30:23.000Z
  13. Yahoo2026-11-02T21:12:34.000Z
  14. Yahoo2026-11-02T20:45:13.000Z
  15. Yahoo2026-11-02T21:54:37.000Z
  16. Yahoo2026-11-02T21:48:34.000Z
  17. Yahoo2026-11-02T21:43:48.000Z
  18. Yahoo2026-11-02T21:50:02.000Z
  19. Yahoo2026-11-02T21:34:17.000Z
  20. Yahoo2026-11-02T21:10:00.000Z
  21. Yahoo2026-11-02T21:02:00.000Z
  22. Yahoo2026-11-02T20:04:00.000Z
  23. Yahoo2026-11-02T19:39:00.000Z
  24. Yahoo2026-11-02T18:53:00.000Z
  25. Yahoo2026-11-02T21:28:07.000Z
  26. Yahoo2026-11-02T21:23:00.000Z
  27. Yahoo2026-11-02T20:00:00.000Z
ES / MESE-mini / Micro E-mini S&P 500Weekly thesis · FULFILLED

The Lines in the Sand

7,557.75Last week's floor, still unbroken; crack it and the drop widens
7,570.75Monday's low, where the late bounce began
7,625Reclaim here and the bear case loses its grip

The Trap

With Nasdaq already through its floor, it is easy to assume the S&P must follow and lean in early just above 7557.75. That thin gap is where impatient bears tend to get squeezed back toward 7601-7621.

Last price7,587
ADR · 30 sessions81.33 pts
Daily EMA217,730.51REJECT
Reopen gapNo opening gap
7,5507,6007,6507,7007,7507,800Tue 9:30Wed 9:30Thu 9:30Fri 9:30Mon 9:30close 16:00Prior week high · 7,819.5Prior week low · 7,557.75H1 · EMA21 · ES / MES 7,587Yellow: 09:30 open · dashed gray: 16:00 close (ET)

The Read

Bears won Monday, rejecting the 7730.51 daily average and dragging price from 7626 to 7587. But bulls still hold one card: the 7570.75 low stayed above last week's 7557.75 floor, so the breakdown Nasdaq got has not shown up here yet. The day was stretched and the close came off the lows, which leaves room for a bounce toward 7601-7621. The evidence clearly tilts lower, but confirmation is still missing. Lose 7557.75 and the floor is gone, with 7538 next; get accepted above 7625 and the bear case starts to wobble.

Yesterday's daily candle · Mon, Nov 2
Open7,626High7,694Low7,570.75Close7,587
bearish · range 123.25 pts
Projected range · next session83 pts7,538 – 7,621

Index drivers

Microsoft, Apple, Nvidia, Meta and Broadcom all closed lower, and chip names AMD and Micron took heavier hits. Amazon, Tesla and Berkshire Hathaway finished higher, so the damage was not uniform. No scheduled earnings dates were listed for the tracked heavyweights.

Market data as of Nov 2, 6:32 PM EST · Weights as of 2026-10-01

Evidence · 11 cited findings

Price action · weekly / daily / H1

  • The forming week declined from 7626 to 7587, but Monday's 7570.75 low remained above the 7557.75 prior-week low, making continuation conditional rather than confirmed.
  • Monday rejected the 7730.51 daily EMA21 and completed a 1.515-ADR bearish candle on 1.103 times average volume.
  • H1 sold sharply below its EMA21 through the afternoon and ended with a modest recovery from 7570.75.
  • The projected path permits a rebound toward 7601-7621 before testing 7557.75; acceptance below that boundary would open the broader extension toward 7538.

Metrics

  • Monday's 123.25-point range used 1.515 ADR, creating seller control but also elevated rebound risk after a stretched session.
  • The final completed H1 range was 19.5 points versus an 18.5-point expansion threshold and was expanding at the close.
  • The daily close was 1.764 ADR below the 7730.51 EMA21, supporting the bearish trend assessment.
  • Unlike MNQ, MES had not broken its prior-week low at the cutoff; this is the principal structural limit on conviction.

Sentiment & current events

  • Major SPY-weighted technology drivers were broadly negative, including NVDA -1.2608%, MSFT -2.8338%, AAPL -1.8309%, META -1.3431% and AVGO -1.1807%; AMZN and BRK.B were notable positive offsets. Source: https://www.ssga.com/us/en/intermediary/etfs/state-street-spdr-sp-500-etf-trust-spy
  • No scheduled FOMC decision falls during November 3-6. Source: https://www.federalreserve.gov/monetarypolicy/fomccalendars.htm
  • Treasury refunding details arrive November 4 at 08:30 ET, and the maturity mix remains an unresolved equity-rate risk. Source: https://home.treasury.gov/news/press-releases/sb0675
Sources & evidence dates · 33
  1. BLS officially schedules September 2026 JOLTS for Nov. 3 at 10:00 a.m. ET, preliminary Q3 productivity and costs for Nov. 5 at 8:30 a.m. ET, and the October Employment Situation for Nov. 6 at 8:30 a.m. ET.2026-02-18
  2. bls.gov2026-02-18
  3. The official Federal Reserve calendar confirms that the FOMC met Oct. 27-28, 2026 and next meets Dec. 8-9, so no scheduled FOMC decision falls within Nov. 3-6.2026-10-28
  4. federalreserve.gov2026-10-28
  5. Treasury officially projects $618 billion of privately held net marketable borrowing for Oct.-Dec. 2026 and $800 billion for Jan.-Mar. 2027, with quarterly-refunding details scheduled for Nov. 4 at 8:30 a.m. ET.2026-11-02
  6. 2026-11-02
  7. bls.gov2026-02-18
  8. tradingview.com2026-11-02
  9. Yahoo2026-11-02T21:47:39.000Z
  10. Yahoo2026-11-02T21:45:04.000Z
  11. Yahoo2026-11-02T21:44:55.000Z
  12. Yahoo2026-11-02T21:30:23.000Z
  13. Yahoo2026-11-02T21:12:34.000Z
  14. Yahoo2026-11-02T20:45:13.000Z
  15. Yahoo2026-11-02T21:54:37.000Z
  16. Yahoo2026-11-02T21:48:34.000Z
  17. Yahoo2026-11-02T21:43:48.000Z
  18. Yahoo2026-11-02T21:50:02.000Z
  19. Yahoo2026-11-02T21:34:17.000Z
  20. Yahoo2026-11-02T21:10:00.000Z
  21. Yahoo2026-11-02T21:02:00.000Z
  22. Yahoo2026-11-02T20:04:00.000Z
  23. Yahoo2026-11-02T19:39:00.000Z
  24. Yahoo2026-11-02T18:53:00.000Z
  25. Yahoo2026-11-02T21:28:07.000Z
  26. Yahoo2026-11-02T21:23:00.000Z
  27. Yahoo2026-11-02T20:00:00.000Z
  28. Yahoo2026-11-02T21:48:41.000Z
  29. Yahoo2026-11-02T21:28:56.000Z
  30. Yahoo2026-11-02T19:09:16.000Z
  31. Yahoo2026-11-02T11:05:53.000Z
  32. Yahoo2026-11-02T11:04:25.000Z
  33. Yahoo2026-11-02T11:00:52.000Z
GC / MGCGold / Micro GoldWeekly thesis · STRESSED

The Lines in the Sand

3,981Monday's ceiling; a clean break puts the rebound in gear
3,944Intraday shelf bulls must defend to keep the bounce alive
3,879.3Last week's floor, held Monday, the base under everything

The Trap

A strong green day after a slide tempts people to declare a bottom, yet price still sits far below the 4104.8 daily average. Chasing strength into 3981 is where late bulls tend to get caught if the rebound stalls.

Last price3,956.5
ADR · 30 sessions77.67 pts
Daily EMA214,104.8REJECT
Reopen gapUP · 2.9 ptsFilled
3,8753,9003,9253,9503,9754,0004,0254,0504,0754,100close 13:30Tue 8:20close 13:30Wed 8:20close 13:30Thu 8:20close 13:30Fri 8:20close 13:30Mon 8:20close 13:30Prior week high · 4,097.3Prior week low · 3,879.3H1 · EMA21 · GC / MGC 3,956.5Yellow: 08:20 open · dashed gray: 13:30 close (ET)

The Read

Bears pressed gold all last week, but Monday bulls pushed back, lifting price from 3889.9 to 3956.5 and holding above last week's 3879.3 floor. The tape then went quiet, parking above 3944 after tagging 3980.9. The lean is slightly up, but this is a rebound, not a reversal: the 4104. Tuesday's JOLTS data and Wednesday's Treasury refunding can push yields and the dollar either way. Hold 3944 and a close above 3981 opens the door toward 3984 and 4012; lose 3944 and slip under 3920 and the rebound is in trouble.

Yesterday's daily candle · Mon, Nov 2
Open3,889.9High3,980.9Low3,888.7Close3,956.5
bullish · range 92.2 pts
Projected range · next session78 pts3,934 – 4,012
Evidence · 14 cited findings

Price action · weekly / daily / H1

  • The forming week is green from 3889.9 to 3956.5 and remains above both the 3884.4 prior-week close and 3879.3 prior-week low.
  • Monday formed a strong 0.858-ADR bullish body and held above the prior-week low, supporting an early-week rebound.
  • Price remains 1.909 ADR below the 4104.8 daily EMA21, so the move is a rebound rather than a confirmed higher-timeframe reversal.
  • H1 advanced from roughly 3905 to 3980.9 and then consolidated above its intraday EMA21 near 3944.8; holding 3944-3950 favors another 3981 test.
  • The projected path dips toward 3952 before recovering toward 3984, with a scenario candle extending to 4012 and closing near 3991.

Metrics

  • Monday's 92.2-point range used 1.187 ADR, with a bullish body representing 0.858 ADR and volume near its 30-day average.
  • The final H1 range was only 3.9 points versus a 23.9-point expansion threshold, and seven bars had passed since the last expansion.
  • A close above 3981 during 08:00-11:00 ET is required for the projected upside expansion.
  • The large distance below the daily EMA21 opposes treating the rebound as a durable trend reversal.

Sentiment & current events

  • World Gold Council reported September gold-ETF inflows of 67 tonnes and record holdings of 4256 tonnes, with Q3 holdings up 211 tonnes, providing structural support. Source: https://www.gold.org/goldhub/research/gold-etfs-holdings-and-flows/2026/10
  • The same World Gold Council report says gold declined despite those inflows as rates, Treasury yields and the dollar rose, showing that ETF demand does not guarantee near-term gains. Source: https://www.gold.org/goldhub/research/gold-etfs-holdings-and-flows/2026/10
  • September JOLTS is scheduled for November 3 at 10:00 ET, but its yield, dollar and gold effects are conditional rather than mechanical. Source: https://www.bls.gov/schedule/2026/11_sched.htm
  • Treasury refunding details on November 4 could affect yields and gold, but the decisive maturity composition was unavailable at the cutoff. Source: https://home.treasury.gov/news/press-releases/sb0675
  • No scheduled FOMC decision occurs during November 3-6. Source: https://www.federalreserve.gov/monetarypolicy/fomccalendars.htm
Sources & evidence dates · 11
  1. BLS officially schedules September 2026 JOLTS for Nov. 3 at 10:00 a.m. ET, preliminary Q3 productivity and costs for Nov. 5 at 8:30 a.m. ET, and the October Employment Situation for Nov. 6 at 8:30 a.m. ET.2026-02-18
  2. bls.gov2026-02-18
  3. The official Federal Reserve calendar confirms that the FOMC met Oct. 27-28, 2026 and next meets Dec. 8-9, so no scheduled FOMC decision falls within Nov. 3-6.2026-10-28
  4. federalreserve.gov2026-10-28
  5. Treasury officially projects $618 billion of privately held net marketable borrowing for Oct.-Dec. 2026 and $800 billion for Jan.-Mar. 2027, with quarterly-refunding details scheduled for Nov. 4 at 8:30 a.m. ET.2026-11-02
  6. World Gold Council reports that global physically backed gold ETFs added 67 tonnes in September 2026, reaching record holdings of 4,256 tonnes, while Q3 holdings increased by 211 tonnes.2026-10-07
  7. gold.org2026-10-07
  8. 2026-11-02
  9. 2026-11-02
  10. bls.gov2026-02-18
  11. tradingview.com2026-11-02
CL / MCLWTI Crude Oil / Micro WTI Crude OilWeekly thesis · STRESSED

The Lines in the Sand

95.13Monday's low; a close under it uncorks more downside
97.7Accepted above here, the slide loses its grip
99.44Last week's floor, smashed Monday and now overhead

The Trap

After a collapse this big on heavy volume, latecomers tend to pile onto the downside right at 95.13, just as the move looks exhausted. Bottom-fishing bulls get caught too if the bounce dies under 97.10-97.70.

Last price96.28
ADR · 30 sessions3.8 pts
Daily EMA2197.14LOSS
Reopen gapUP · 0.1 ptsFilled
9698100102104close 14:30Tue 9:00close 14:30Wed 9:00close 14:30Thu 9:00close 14:30Fri 9:00close 14:30Mon 9:00close 14:30Prior week high · 104.99Prior week low · 99.44H1 · EMA21 · CL / MCL 96.28Yellow: 09:00 open · dashed gray: 14:30 close (ET)

The Read

Bears flattened crude Monday, dragging it from 102.41 to 96.28 and through last week's 99.44 floor on heavy volume. Bulls showed up at 95.13 and clawed back, so the fight now sits just under the 97.14 daily average. There is a real caveat: another source put Monday's close near 102.27, a contract mismatch nobody has reconciled, and inventory and supply-risk stories argue the other way. The lean is lower, but the ground is soft. Stay capped under 97.10-97.70 and a retest of 95.13 is in play; reclaim 97.70 and the slide loses steam.

Yesterday's daily candle · Mon, Nov 2
Open102.41High102.76Low95.13Close96.28
bearish · range 7.63 pts
Projected range · next session3.6 pts93.95 – 97.55
Evidence · 9 cited findings

Price action · weekly / daily / H1

  • H1 stabilized after reaching 95.13 and recovered to 96.28, allowing consolidation or a relief bounce before any continuation.
  • Failure beneath 97.10-97.70 favors a retest of 95.13; a close below 95.13 during 08:00-11:00 ET is required for projected expansion toward 93.95.
  • A separate supplied source reported approximately 102.27 for November 2, creating an unresolved contract or data-mapping conflict with the 96.28 price action record.

Metrics

  • The price action's 2.008-ADR range and 2.762-times-average volume would normally strongly support bearish continuation while also indicating exhaustion risk.
  • The final H1 range was 0.69 versus a 0.82 expansion threshold, so expansion was not active at the close.
  • Exact contract roll, timestamp and adjustment methodology were unavailable.

Sentiment & current events

  • The approximately 102.27 secondary-source close conflicts materially with the price action's 96.28 record and cannot be reconciled without contract-month or roll information. Source: https://worldoilmonitor.com/daily-oil-market-summary
  • September JOLTS is scheduled for November 3 at 10:00 ET, but its oil impact is conditional because growth interpretation and risk sentiment can dominate. Source: https://www.bls.gov/schedule/2026/11_sched.htm
  • Social and secondary commentary cannot independently validate the current MCL contract or its price levels.
Sources & evidence dates · 6
  1. BLS officially schedules September 2026 JOLTS for Nov. 3 at 10:00 a.m. ET, preliminary Q3 productivity and costs for Nov. 5 at 8:30 a.m. ET, and the October Employment Situation for Nov. 6 at 8:30 a.m. ET.2026-02-18
  2. bls.gov2026-02-18
  3. worldoilmonitor.com2026-11-02
  4. 2026-11-02
  5. bls.gov2026-02-18
  6. tradingview.com2026-11-02

Free. Always. Futures trading edge in your inbox.

You're in. Watch your inbox.

We do not send junk mail. We do not spam.