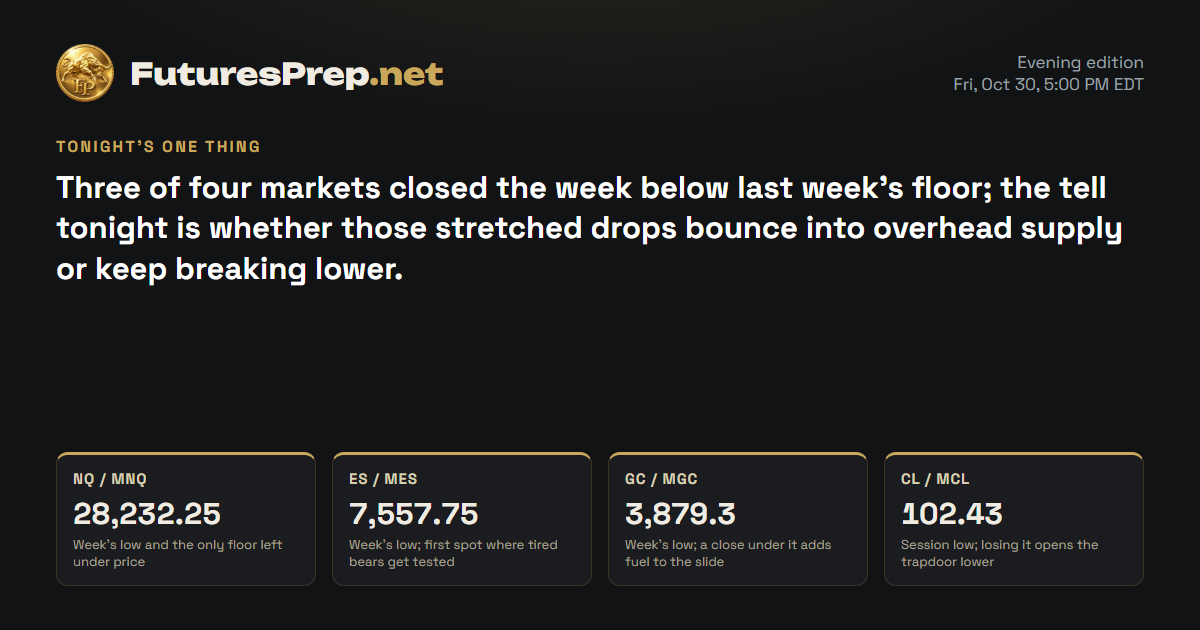
The Lines in the Sand
The Trap
After a drop this big, late shorts tend to pile in right at 28232.25 and get squeezed by a reflex bounce. Dip hunters then grab that bounce into 28860 to 29040 and get caught when supply leans back on it.
The Read
Bulls who tried to hold last week's high at 30114 got run over: price failed there, sliced through 28986.25 and closed at 28545.75, deep in the bottom of the range. The daily bar was wide and heavy on volume, and it closed far below the 29826.69 average that rejected it. Bears own the hourly chart, with lower highs and lower lows under a falling average. The catch is the stretch itself: a drop this extended often snaps back first, so a bounce into 28860 to 29040 would fit the picture without changing it. Hold under 29217.75 and the bears keep the wheel; lose 28232.25 and the floor is gone.
Index drivers
| Ticker | Approx. weight | Day move | Next earnings | Top headline |
|---|---|---|---|---|
| NVDA | 8.4% | −4.22% | — | MPLX Reports Earnings on Nov. 3, 2026. Here's What Investors Should Be Watching. |
| MSFT | 5.75% | −1.55% | — | 1 Reason to Buy Microsoft Stock for 10 Years |
| AAPL | 7.28% | −1.23% | — | Apple to report Q4 earnings Monday, with iPhone 18 sales in the spotlight |
| AMZN | 4.04% | −1.41% | — | Walmart's $120 Walmart+ and Sam's Club Plus bundle undercuts Amazon Prime's $139 fee with gas, grocery and more perks |
| META | 3.26% | −1.53% | — | SpaceX Stock Is Nearly 30% Below Its Post-IPO High. Here's What Facebook's Stock Did From the Same Spot. |
| AVGO | 2.47% | −5.48% | — | 5 Huge Winners From Anthropic's IPO |
| GOOGL | 3% | −1.4% | — | Jobs, Midterm Elections, Apple, Palantir, McDonald’s, Moderna, and More to Watch This Week |
| TSLA | 2.81% | −0.87% | — | Barclays Says a SpaceX Merger Is Now "a Key Part" of the Tesla Bull Case. Here's Who Actually Wins if It Happens -- and Who Pays. |
The Nasdaq heavyweights all closed lower on Friday, Oct. 30, with Broadcom and Nvidia taking the sharpest hits and Microsoft, Apple, Amazon, Meta, Alphabet and Tesla also down.
Market data as of Nov 1, 6:32 PM EST · Weights as of 2026-09-30
Evidence · 10 cited findings
Price action · weekly / daily / H1
- Weekly price swept both prior-week extremes, failed above 30114, accepted below 28986.25 and closed at 28545.75 near the lower portion of the range, favoring bearish continuation.
- The completed daily candle was bearish across 1.726 ADR with a 0.669 body, 1.411 times average volume and a close 2.33 ADR below the rejected 29826.69 EMA21.
- H1 structure remained below its declining EMA21 with lower highs and lows; 28232.25 is immediate support, 28860-29040 is rebound supply and acceptance above 29217.75 would weaken the bearish path.
- The 1.726-ADR daily range is stretched, making an opening rebound or consolidation the strongest contradiction to immediate continuation.
Metrics
- The 41.25-point upward reopening gap is only 0.075 ADR; its same-session historical fill rate is 87.13% with a one-hour median across 101 observations.
- The latest completed bar is 50.5 hours old because of the weekend, so no current Treasury-yield, DXY, volatility, breadth or overnight-futures confirmation is available.
- Major QQQ drivers were broadly weak on Oct. 30, including NVDA -4.22%, AVGO -5.48%, MSFT -1.55% and AAPL -1.23%; these are stale supporting context, not directional inputs (https://www.invesco.com/qqq-etf/en/about.html).
Sentiment & current events
- The wider week includes JOLTS Tuesday, ADP and ISM Services Wednesday, claims Thursday, and employment plus Michigan sentiment Friday; release dates remain tentative (https://www.newyorkfed.org/research/calendars/i-nov26.html).
- Apple earnings are reported in supplied driver headlines as a Monday catalyst, but no primary-source release time or earnings estimate was verified (https://finnhub.io/api/news?id=736ba7ac89fc9997bc25736ddda0c363a761d165f9d0f5537e144c26f12e01d7).
- No authoritative current options positioning, dealer gamma, crowd-sentiment sample or institutional-exposure data was obtained.
Sources & evidence dates · 23
- newyorkfed.org
- newyorkfed.org
- iea.org2026-10-21
- tradingview.com
- Yahoo2026-11-01T21:28:01.000Z
- Yahoo2026-11-01T21:22:00.000Z
- Yahoo2026-11-01T21:05:00.000Z
- Yahoo2026-11-01T18:03:00.000Z
- Yahoo2026-11-01T16:57:37.000Z
- Yahoo2026-11-01T16:30:00.000Z
- Yahoo2026-11-01T19:01:38.000Z
- Yahoo2026-11-01T19:00:00.000Z
- Yahoo2026-11-01T17:29:01.000Z
- Yahoo2026-11-01T19:00:00.000Z
- Yahoo2026-11-01T16:24:00.000Z
- Yahoo2026-11-01T20:03:01.000Z
- Yahoo2026-11-01T15:15:02.000Z
- Yahoo2026-11-01T15:00:03.000Z
- SeekingAlpha2026-11-01T13:25:02.000Z
- SeekingAlpha2026-11-01T09:55:22.000Z
- Yahoo2026-11-01T17:08:11.000Z
- Yahoo2026-11-01T16:26:54.000Z