Session Prep

Two minutes tonight. A plan tomorrow.
Morning review · Data as of Mon, Nov 2, 7:00 AM EST · All times Eastern
Deep research

This morning's one thing

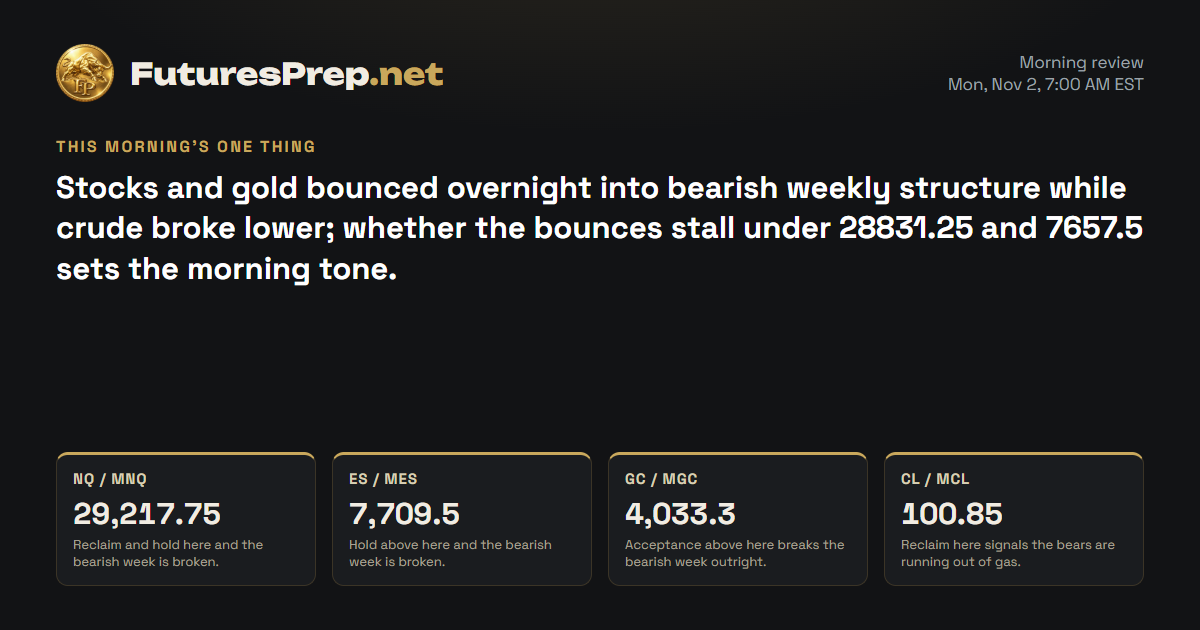
Stocks and gold bounced overnight into bearish weekly structure while crude broke lower; whether the bounces stall under 28831.25 and 7657.5 sets the morning tone.

Today's market movers · Monday, November 2

Time ETImpactEventForecastPrevious
10:00 AMMediumISM Manufacturing PMI54.554.5

U.S. releases, high and medium impact.

NQ / MNQE-mini / Micro E-mini Nasdaq-100Weekly thesis · STRESSED

The Lines in the Sand

29,217.75Reclaim and hold here and the bearish week is broken.
28,831.25Overnight bounce stalled here; acceptance above opens a squeeze.
28,545.75Open gap below, a magnet if the bounce cracks.

The Trap

Late shorts tend to pile in near the overnight low just as the open gap at 28545.75 fills and price snaps back. The other side gets caught chasing the bounce into 28831.25, where it already stalled once.

Last price28,752.75
ADR · 30 sessions549.65 pts
Daily EMA2129,826.69BELOW
Reopen gapUP · 41.25 ptsOpen · 0.075 ADR
28,25028,50028,75029,00029,25029,50029,75030,00030,250Mon 9:30Tue 9:30Wed 9:30Thu 9:30Fri 9:30Gap fill · 28,545.75Prior week high · 30,180Prior week low · 28,232.25H1 · EMA21 · NQ / MNQ 28,752.75Dashed: last night's path

The Read

Bulls who tried to hold last week's high at 30114 got run over: price failed there, sliced through 28986.25 and closed at 28545.75, deep in the bottom of the range. The daily bar was wide and heavy on volume, and it closed far below the 29826.69 average that rejected it. Bears own the hourly chart, with lower highs and lower lows under a falling average. The catch is the stretch itself: a drop this extended often snaps back first, so a bounce into 28860 to 29040 would fit the picture without changing it. Hold under 29217.75 and the bears keep the wheel; lose 28232.25 and the floor is gone.

Morning review · Nov 2, 7:30 AM EST

Bears own the bigger picture, but bulls had the overnight tape, lifting price from 28587 to 28752.75 after last week closed near its lows. The bounce stalled at 28831.25 and is coiling, still far beneath the daily average at 29826.69, so the heavier evidence still sides with the bears. Early news of higher Nasdaq futures is the strongest case against them. A close below 28720 reopens the path to 28582.75 and the gap at 28545.75; accept above 28831.25 and a squeeze toward 29000 is live, with 29217.75 the line that breaks the bearish week.

Overnight evidence · 11 cited findings

Overnight price action

  • Price rose from the 28587 session open to 28752.75, a net gain of 165.75 points.
  • The overnight range was 28582.75-28831.25, equal to 0.452 ADR.
  • The market did not cross or close through the 29217.75 weekly invalidation.
  • The prior projected decline to 28310 did not occur, and the 28545.75 gap remained unfilled.

Overnight events

  • No verified scheduled macro release inside the overnight interval supplied a causal explanation for the rebound.
  • Early market reporting confirmed higher Nasdaq-100 futures before the cash open (https://finance.yahoo.com/markets/article/stock-futures-jump-ahead-of-a-monster-week-after-a-5-trillion-ai-rout-021203996.html).
  • UKMTO's latest available report retained a SEVERE Strait of Hormuz threat level, representing broad risk-event uncertainty rather than a direct equity signal (https://www.ukmto.org/-/media/ukmto/products/20261030-ukmto_vra_overview_u.pdf).

What changed

  • Price action retains bearish direction but the overnight rebound lowers conviction and changes the expected intraday path.
  • The unfilled gap's historical tendency supports a retracement toward 28545.75 if 28720 breaks.
  • Verified sentiment evidence opposes immediate downside, while later Apple event risk adds uncertainty.
  • Acceptance above 29217.75 would invalidate the active weekly bearish structure.
Yesterday's daily candle · Fri, Oct 30
Open29,180High29,180.75Low28,232.25Close28,545.75
bearish · range 948.5 pts
Projected range · next session765 pts28,070 – 28,835

Index drivers

Every heavyweight on the list closed Friday lower, with Broadcom and NVIDIA taking the hardest hits and Tesla the lightest. Microsoft, Apple, Amazon, Meta and Alphabet all slipped as well. Apple faces its first earnings test under a new CEO, with its conference read after today's close.

Market data as of Nov 2, 7:32 AM EST · Weights as of 2026-09-30

Evidence · 10 cited findings

Price action · weekly / daily / H1

  • Weekly price swept both prior-week extremes, failed above 30114, accepted below 28986.25 and closed at 28545.75 near the lower portion of the range, favoring bearish continuation.
  • The completed daily candle was bearish across 1.726 ADR with a 0.669 body, 1.411 times average volume and a close 2.33 ADR below the rejected 29826.69 EMA21.
  • H1 structure remained below its declining EMA21 with lower highs and lows; 28232.25 is immediate support, 28860-29040 is rebound supply and acceptance above 29217.75 would weaken the bearish path.
  • The 1.726-ADR daily range is stretched, making an opening rebound or consolidation the strongest contradiction to immediate continuation.

Metrics

  • The 41.25-point upward reopening gap is only 0.075 ADR; its same-session historical fill rate is 87.13% with a one-hour median across 101 observations.
  • The latest completed bar is 50.5 hours old because of the weekend, so no current Treasury-yield, DXY, volatility, breadth or overnight-futures confirmation is available.
  • Major QQQ drivers were broadly weak on Oct. 30, including NVDA -4.22%, AVGO -5.48%, MSFT -1.55% and AAPL -1.23%; these are stale supporting context, not directional inputs (https://www.invesco.com/qqq-etf/en/about.html).

Sentiment & current events

  • The wider week includes JOLTS Tuesday, ADP and ISM Services Wednesday, claims Thursday, and employment plus Michigan sentiment Friday; release dates remain tentative (https://www.newyorkfed.org/research/calendars/i-nov26.html).
  • Apple earnings are reported in supplied driver headlines as a Monday catalyst, but no primary-source release time or earnings estimate was verified (https://finnhub.io/api/news?id=736ba7ac89fc9997bc25736ddda0c363a761d165f9d0f5537e144c26f12e01d7).
  • No authoritative current options positioning, dealer gamma, crowd-sentiment sample or institutional-exposure data was obtained.
Sources & evidence dates · 23
  1. newyorkfed.org
  2. newyorkfed.org
  3. iea.org2026-10-21
  4. tradingview.com
  5. Yahoo2026-11-02T11:55:00.000Z
  6. Yahoo2026-11-02T11:50:00.000Z
  7. Yahoo2026-11-02T11:38:12.000Z
  8. Yahoo2026-11-02T11:06:11.000Z
  9. Yahoo2026-11-02T11:06:00.000Z
  10. Yahoo2026-11-02T11:05:53.000Z
  11. Yahoo2026-11-02T11:38:24.000Z
  12. Yahoo2026-11-02T11:35:58.000Z
  13. Yahoo2026-11-02T11:27:00.000Z
  14. Yahoo2026-11-02T11:22:47.000Z
  15. Yahoo2026-11-02T11:05:45.000Z
  16. Yahoo2026-11-02T11:21:01.000Z
  17. Yahoo2026-11-02T11:05:23.000Z
  18. Yahoo2026-11-02T11:05:38.000Z
  19. Yahoo2026-11-02T11:05:26.000Z
  20. Yahoo2026-11-02T11:30:00.000Z
  21. Yahoo2026-11-02T11:38:01.000Z
  22. Yahoo2026-11-02T11:03:08.000Z
ES / MESE-mini / Micro E-mini S&P 500Weekly thesis · STRESSED

The Lines in the Sand

7,709.5Hold above here and the bearish week is broken.
7,657.5Overnight ceiling; acceptance above opens the door higher.
7,614.5Open gap below, the pull if 7636.25 gives way.

The Trap

The gap at 7614.5 acts like a magnet, and shorts who press near 7625.5 often find the low already in once it fills. Bulls get caught on the other side treating a quick poke over 7657.5 as a breakout before it actually holds.

Last price7,649
ADR · 30 sessions81.67 pts
Daily EMA217,744.98BELOW
Reopen gapUP · 11.5 ptsOpen · 0.141 ADR
7,5507,6007,6507,7007,7507,800Mon 9:30Tue 9:30Wed 9:30Thu 9:30Fri 9:30Gap fill · 7,614.5Prior week high · 7,819.5Prior week low · 7,557.75H1 · EMA21 · ES / MES 7,649Dashed: last night's path

The Read

Bulls pushed through last week's high at 7811.75 and got thrown back; bears then broke 7648.5 and kept price under it into a 7614.5 close. The daily bar was wide, heavy on volume, and finished well below the 7744.98 average that turned it away. The hourly chart is a staircase down into 7557.75. The strongest pushback is that range itself: a stretch this large often invites a snapback, with 7654 to 7694 the first wall overhead. Stay below 7709.5 and the bears keep control; recover 7713 and the door opens back up for bulls.

Morning review · Nov 2, 7:30 AM EST

Bears won last week, and bulls spent the night clawing back, lifting price from 7626 to 7649 off the 7557.75 low. The bounce was turned away at 7657.5 and momentum has gone flat just under it, with the daily average far overhead at 7744.98, so the bigger structure still clearly leans bearish. Higher S&P futures overnight are the best argument against that lean. A close below 7636.25 puts 7625.5 and the gap at 7614.5 in play; acceptance above 7657.5 opens 7675-7690, and only a hold above 7709.5 breaks the bearish week.

Overnight evidence · 11 cited findings

Overnight price action

  • Price rose from the 7626 session open to 7649, a net gain of 23 points.
  • The overnight range was 7625.5-7657.5, equal to 0.392 ADR.
  • Price did not cross or close through the 7709.5 weekly invalidation.
  • The prior expected decline to 7572 did not occur, and the 7614.5 gap remained unfilled.

Overnight events

  • No verified scheduled macro release inside the overnight interval supplied a directional catalyst.
  • Early market reporting confirmed higher S&P 500 futures before the cash open (https://finance.yahoo.com/markets/article/stock-futures-jump-ahead-of-a-monster-week-after-a-5-trillion-ai-rout-021203996.html).
  • The latest UKMTO report retained a SEVERE Hormuz threat level, adding broad tail risk without establishing equity direction (https://www.ukmto.org/-/media/ukmto/products/20261030-ukmto_vra_overview_u.pdf).

What changed

  • Price action retains bearish direction, but the overnight miss reduces conviction and changes the expected path.
  • The unfilled gap's historical tendency supports a decline toward 7614.5 if 7636.25 breaks.
  • Verified sentiment evidence opposes immediate downside, while later Apple event risk adds uncertainty.
  • Acceptance above 7709.5 would invalidate the active weekly bearish structure.
Yesterday's daily candle · Fri, Oct 30
Open7,709.25High7,713Low7,557.75Close7,614.5
bearish · range 155.25 pts
Projected range · next session133 pts7,528 – 7,661

Index drivers

AMD led Friday's damage among the heavyweights, with Micron, Broadcom and NVIDIA also sliding hard. Microsoft, Apple, Amazon, Meta, Alphabet and Tesla all finished lower, while Berkshire Hathaway was the lone name to close up. Apple's earnings conference read lands after today's close.

Market data as of Nov 2, 7:32 AM EST · Weights as of 2026-10-01

Evidence · 9 cited findings

Price action · weekly / daily / H1

  • Weekly price swept above 7811.75, failed there, broke 7648.5 and accepted below that prior-week low before closing at 7614.5.
  • The daily candle was bearish across 1.901 ADR on 1.429 times average volume and closed 1.598 ADR below the rejected 7744.98 EMA21.
  • H1 remained below its declining EMA21 with lower highs and lows into 7557.75; 7654-7694 is rebound resistance and recovery above 7713 would materially weaken the bearish path.
  • The unusually large daily range creates mean-reversion risk and is the strongest contradiction to immediate downside continuation.

Metrics

  • The 11.5-point upward reopening gap is 0.141 ADR and has a 93.62% same-session historical fill rate with a one-hour median across 94 observations.
  • Major SPY drivers were weak on Oct. 30, including NVDA -4.22%, AVGO -5.48%, AMD -10.88%, MSFT -1.55% and AAPL -1.23%; this is stale supporting context only (https://www.ssga.com/us/en/intermediary/etfs/state-street-spdr-sp-500-etf-trust-spy).

Sentiment & current events

  • ISM Manufacturing is scheduled Nov. 2 at 10:00 ET, after the forecast window; timing is verified but consensus estimates are not (https://www.newyorkfed.org/research/calendars/i-nov26.html).
  • JOLTS, ADP, ISM Services, claims, payrolls and Michigan sentiment create substantial event risk later in the week (https://www.newyorkfed.org/research/calendars/i-nov26.html).
  • No authoritative options positioning, dealer gamma, current breadth or reproducible crowd-sentiment sample was available.
Sources & evidence dates · 25
  1. newyorkfed.org
  2. newyorkfed.org
  3. iea.org2026-10-21
  4. tradingview.com
  5. Yahoo2026-11-02T11:55:00.000Z
  6. Yahoo2026-11-02T11:50:00.000Z
  7. Yahoo2026-11-02T11:38:12.000Z
  8. Yahoo2026-11-02T11:06:11.000Z
  9. Yahoo2026-11-02T11:06:00.000Z
  10. Yahoo2026-11-02T11:05:53.000Z
  11. Yahoo2026-11-02T11:38:24.000Z
  12. Yahoo2026-11-02T11:35:58.000Z
  13. Yahoo2026-11-02T11:27:00.000Z
  14. Yahoo2026-11-02T11:22:47.000Z
  15. Yahoo2026-11-02T11:05:45.000Z
  16. Yahoo2026-11-02T11:21:01.000Z
  17. Yahoo2026-11-02T11:05:23.000Z
  18. Yahoo2026-11-02T11:05:38.000Z
  19. Yahoo2026-11-02T11:05:26.000Z
  20. Yahoo2026-11-02T11:30:00.000Z
  21. Yahoo2026-11-02T11:38:01.000Z
  22. Yahoo2026-11-02T11:03:08.000Z
  23. Yahoo2026-11-02T11:04:25.000Z
  24. Yahoo2026-11-02T11:00:52.000Z
GC / MGCGold / Micro GoldWeekly thesis · STRESSED

The Lines in the Sand

4,033.3Acceptance above here breaks the bearish week outright.
3,928.8Bounce high; lower highs have stacked beneath it since midnight.
3,884.4Open gap below, in reach if 3900 fails.

The Trap

Bounces off last week's 3879.3 low look like a turn, and late bulls tend to get caught as lower highs keep stacking under 3928.8. Shorts get squeezed when they lean on price right after the gap at 3884.4 fills.

Last price3,910.7
ADR · 30 sessions76.65 pts
Daily EMA214,119.69BELOW
Reopen gapUP · 5.5 ptsOpen · 0.072 ADR
3,8503,9003,9504,0004,0504,100Mon 8:20close 13:30Tue 8:20close 13:30Wed 8:20close 13:30Thu 8:20close 13:30Fri 8:20close 13:30Gap fill · 3,884.4Prior week high · 4,097.3Prior week low · 3,879.3H1 · EMA21 · GC / MGC 3,910.7Dashed: last night's path

The Read

Gold bulls lost the floor at 3989 and never got it back; price closed at 3884.4, barely above the week's low, with almost nobody stepping up to defend it. The daily bar was nearly all body on heavy volume, far below the 4119.69 average that rejected it. Bears have the cleanest momentum on the board, and speculative longs have been shrinking. Two things push back: the drop is badly stretched, and the World Gold Council shows record ETF holdings and record third-quarter inflows, real demand sitting underneath. Close below 3879.3 and the slide has fresh fuel; reclaim 4009.5 and the immediate downside path is broken.

Morning review · Nov 2, 7:30 AM EST

Gold bulls are scrambling to stem the bleeding after last week's heavy slide, lifting price from 3889.9 to 3910.7 overnight. The bounce topped at 3928.8 and has printed lower highs since midnight, with the daily average way up at 4119.69, so the price evidence still clearly favors the bears. Strong gold ETF inflows are the biggest case against them. Close below 3900 and 3888.7 plus the gap at 3884.4 come into view; accept above 3929 and a push toward 3950 opens, with 4033.3 the level that breaks the bearish week.

Overnight evidence · 11 cited findings

Overnight price action

  • Price rose from the 3889.9 session open to 3910.7, a net gain of 20.8 points.
  • The overnight range was 3888.7-3928.8, equal to 0.523 ADR.
  • Price did not cross or close through the 4033.3 weekly invalidation.
  • The prior expected decline to 3842 did not occur, and the 3884.4 gap remained unfilled.

Overnight events

  • No verified scheduled macro release inside the overnight interval supplied a directional catalyst.
  • World Gold Council structural-demand evidence remained active but was not a new overnight observation (https://www.gold.org/goldhub/research/gold-etfs-holdings-and-flows/2026/10).
  • The latest available UKMTO report maintained a SEVERE Hormuz threat level, adding geopolitical uncertainty without determining gold direction (https://www.ukmto.org/-/media/ukmto/products/20261030-ukmto_vra_overview_u.pdf).

What changed

  • Price action retains bearish direction but the overnight miss lowers conviction and changes the expected path.
  • The unfilled gap's historical tendency supports a decline toward 3884.4 if 3900 breaks.
  • Verified ETF demand and reduced crowding oppose a clean bearish fundamental case.
  • Acceptance above 4033.3 would invalidate the active weekly bearish structure.
Yesterday's daily candle · Fri, Oct 30
Open4,033.7High4,038.2Low3,879.3Close3,884.4
bearish · range 158.9 pts
Projected range · next session116 pts3,818 – 3,934
Evidence · 9 cited findings

Price action · weekly / daily / H1

  • Weekly price broke and accepted below 3989, then closed at 3884.4 only 5.1 points above the weekly low, showing strong downside acceptance with little responsive buying.
  • The daily candle was 0.940 body, spanned 2.073 ADR on 1.398 times average volume and closed 3.07 ADR below the rejected 4119.69 EMA21.
  • H1 formed an orderly decline below a rapidly falling EMA21; a close below 3879.3 favors continuation, while 3930-3964 is initial supply and recovery above 4009.5 would invalidate the immediate downside path.
  • The extreme extension of the daily decline creates substantial snapback risk and is the strongest near-term contradiction.

Metrics

  • The 5.5-point upward reopening gap is 0.072 ADR and has a 95.83% same-session fill rate with a one-hour median across 48 observations.
  • World Gold Council data show September COMEX net longs fell 13%, or 100 tonnes, to 654 tonnes, with managed-money net longs down 84 tonnes to 387 tonnes, corroborating weaker speculative momentum (https://www.gold.org/goldhub/research/gold-etfs-holdings-and-flows/2026/10).

Sentiment & current events

  • World Gold Council reported September ETF inflows of US$10 billion, record Q3 inflows of US$31 billion and record holdings of 4256 tonnes; this structurally opposes the bearish read but does not establish an immediate reversal (https://www.gold.org/goldhub/research/gold-etfs-holdings-and-flows/2026/10).
  • Falling speculative net longs support weaker momentum but also imply less remaining crowded-long liquidation risk (https://www.gold.org/goldhub/research/gold-etfs-holdings-and-flows/2026/10).
  • No current authoritative options positioning, central-bank purchase update or reproducible crowd-sentiment sample was available.
Sources & evidence dates · 5
  1. World Gold Council reported September global gold-ETF inflows of US$10 billion, record Q3 inflows of US$31 billion and a 67-tonne increase in holdings to a record 4,256 tonnes. This supplies a structural-demand contradiction to the strongly bearish MGC price-action thesis, but it does not establish near-term direction.2026-10-07
  2. World Gold Council reported total COMEX net longs down 13% or 100 tonnes to 654 tonnes during September, with managed-money net longs down 84 tonnes to 387 tonnes. Reduced speculative sponsorship corroborates weaker gold momentum while also implying less remaining crowded-long liquidation risk.2026-10-07
  3. iea.org2026-10-21
  4. tradingview.com
CL / MCLWTI Crude Oil / Micro WTI Crude OilWeekly thesis · STRESSED

The Lines in the Sand

100.85Reclaim here signals the bears are running out of gas.
99.44Last week's low, swept but not yet accepted below.
99.08Overnight low; a close under it opens the next leg.

The Trap

Breaks below an old weekly low like 99.44 tend to trap late shorts when price snaps back above it. Bulls get caught on the other side treating Hormuz headlines as a floor while the hourly chart keeps printing lower lows.

Last price99.7
ADR · 30 sessions3.71 pts
Daily EMA2197.23ABOVE
Reopen gapDOWN · -0.56 ptsOpen · 0.151 ADR
99100101102103104105Mon 9:00close 14:30Tue 9:00close 14:30Wed 9:00close 14:30Thu 9:00close 14:30Fri 9:00close 14:30Gap fill · 102.97Prior week high · 104.99Prior week low · 99.44H1 · EMA21 · CL / MCL 99.7Dashed: last night's path
Overnight: invalidated

The Read

INVALIDATED

Crude bulls and bears fought to a draw. Price poked above last week's high at 103.93, tagged 104.99, couldn't stay there and closed at 102.97, almost right on the week's open. The daily chart still sits well above its 97.23 average, but the hourly turned down and lost its own average, leaning on 102.43. Tight U.S. inventories and steep tanker costs back the bulls, while softer fuel demand takes the edge off, so the edge is thin either way and the range is the story. Lose 102.43 and the floor gives way toward 101.55; reclaim 104.15 and the pressure swings back to the upside.

Morning review · Nov 2, 7:30 AM EST

Bears ran the overnight show in crude, dragging price from 102.41 to 99.7 and sweeping under last week's 99.44 low to 99.08. The sweep has not been accepted, the daily average at 97.23 sits underneath as support, and tanker attacks near Hormuz keep a risk premium in the background. That leaves only a slight tilt toward the downside. Close below 99.08 and 98.20-97.30 opens up; reclaim 100.85 and the bears look tired, with a corrective bounce in play.

Overnight evidence · 11 cited findings

Overnight price action

  • Price fell from the 102.41 session open to 99.7, a net decline of 2.71 points.
  • The overnight range was 99.08-102.76, equal to 0.993 ADR.
  • Price took the prior-week 99.44 low but had not accepted below it at the cutoff.
  • The prior path expected rotation near 102.85 by 06:00; the actual 99.7 close decisively invalidated that scenario.

Overnight events

  • OPEC's Nov. 1 official decision superseded provisional reporting and maintained existing December production requirements (https://www.opec.org/pr-detail/620-1-november-2026.html).
  • The latest UKMTO evidence retained a SEVERE Hormuz threat level after two tanker attacks (https://www.ukmto.org/-/media/ukmto/products/20261030-ukmto_vra_overview_u.pdf).
  • No new EIA weekly petroleum release was available during the overnight interval.

What changed

  • Decisive bearish price action invalidates the prior flat intraday read and owns the new session direction.
  • Verified supply and maritime-risk evidence strongly opposes bearish fundamentals, reducing confidence rather than changing direction.
  • The 102.97 gap is unlikely to fill during this session unless price first reclaims 100.85 and sustains a much larger reversal.
  • Acceptance below 99.08 favors continuation, while recovery above 100.85 would signal exhaustion.
Yesterday's daily candle · Fri, Oct 30
Open102.8High104.99Low102.43Close102.97
doji · range 2.56 pts
Projected range · next session2.5 pts101.55 – 104.05
⚠ Flat / choppy conditions likely
Evidence · 11 cited findings

Price action · weekly / daily / H1

  • Weekly price swept 103.93 without accepting above it, held well above 95.26 and closed at 102.97 near its 102.55 open, leaving a rotational doji rather than a directional edge.
  • Daily price held 1.549 ADR above the 97.23 EMA21 on 2.322 times average volume, preserving the bullish regime, but its narrow body after testing 104.99 showed balance rather than acceptance.
  • H1 reversed from 104.99 and closed below its EMA21 at 102.97, creating pressure toward 102.43-101.55; the conflict with daily strength supports a volatile range.
  • A close below 102.43 would favor downside expansion, while reclaiming 104.15 would restore upside pressure.

Metrics

  • The 0.56 downward reopening gap is 0.151 ADR and has a 73.33% same-session fill rate, a 10.5-hour median and only 15 observations; a fill is favored but less certain than for the other symbols.
  • EIA reported crude inventories down 1.9 million barrels to 410.6 million, 4% below the five-year average, while total petroleum inventories fell 3 million barrels (https://ir.eia.gov/wpsr/summary.txt).
  • EIA also reported four-week total product supplied up only 0.2% year over year, with gasoline, distillate and jet-fuel demand measures lower, offsetting the tight inventory signal (https://ir.eia.gov/wpsr/summary.txt).

Sentiment & current events

  • IEA reported exceptional freight stress, including roughly US$27 per barrel for Middle East Gulf-to-Japan LR1 freight and above US$37 per barrel for a separate large crude-tanker route, supporting delivered prices (https://www.iea.org/commentaries/the-soaring-cost-of-shipping-is-lifting-the-price-of-oil-for-consumers).
  • Tight U.S. inventories and high tanker costs are bullish counterweights, while soft product-demand growth limits directional conviction.
  • The standard EIA Weekly Petroleum Status Report is scheduled Wednesday at 10:30 ET, outside the overnight window (https://www.eia.gov/petroleum/supply/weekly/schedule.php).
  • No current verified Gulf-flow update, refinery-damage assessment, sanctions-waiver effect, options positioning or reproducible crowd-sentiment sample was obtained.
Sources & evidence dates · 5
  1. For the week ending Oct. 23, EIA reported commercial crude inventories down 1.9 million barrels to 410.6 million, 4% below the five-year average; total commercial petroleum inventories fell 3.0 million barrels. Refinery utilization was 92.8%. Four-week total product supplied was up only 0.2% year over year, while gasoline, distillate and jet-fuel product supplied fell 0.7%, 0.6% and 3.5%, respectively. This is a mixed MCL backdrop: tight inventories but soft end-demand growth.2026-10-28
  2. EIA's standard Weekly Petroleum Status Report release is Wednesday at 10:30 ET, confirming the Nov. 4 catalyst. The report covering the week ending Nov. 6 is explicitly rescheduled to Thursday, Nov. 12 at 12:00 ET because of Veterans Day.
  3. iea.org2026-10-21
  4. tradingview.com

Free. Always. Futures trading edge in your inbox.

You're in. Watch your inbox.

We do not send junk mail. We do not spam.