Session Prep

Two minutes tonight. A plan tomorrow.
Evening edition · Data as of Thu, Oct 29, 5:00 PM EDT · All times Eastern
Deep research

Tonight's one thing

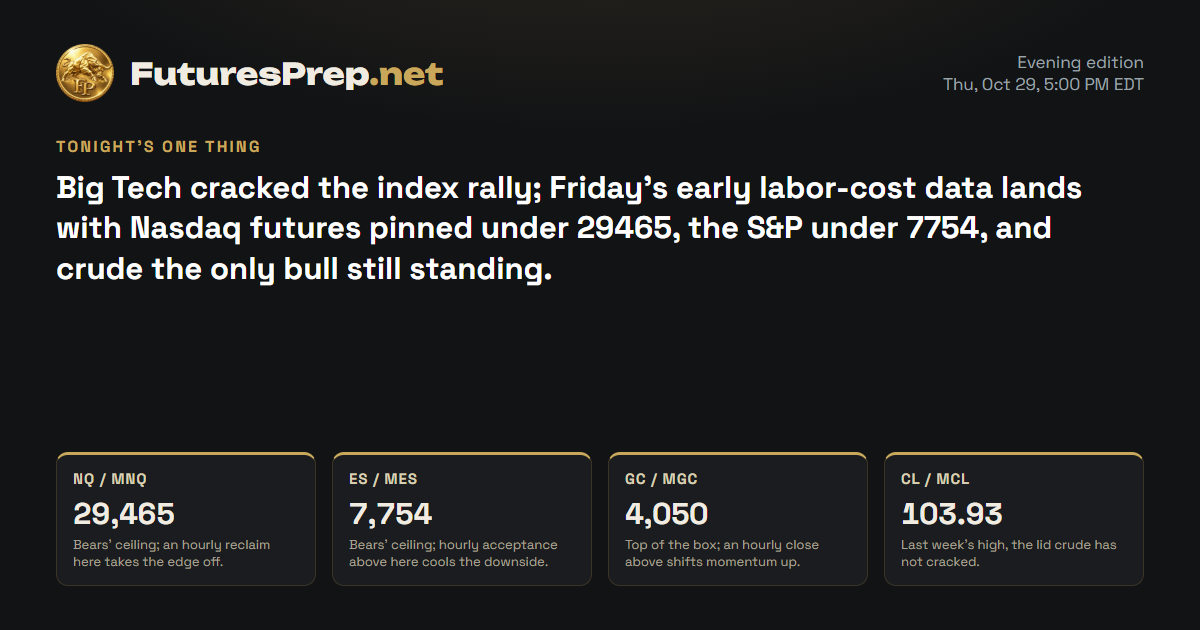
Big Tech cracked the index rally; Friday's early labor-cost data lands with Nasdaq futures pinned under 29465, the S&P under 7754, and crude the only bull still standing.

Tomorrow's market movers · Friday, October 30

Time ETImpactEventForecastPrevious
8:30 AMMediumEmployment Cost Index q/q0.8%0.9%

U.S. releases, high and medium impact.

NQ / MNQE-mini / Micro E-mini Nasdaq-100Weekly thesis · FULFILLED

The Lines in the Sand

29,465Bears' ceiling; an hourly reclaim here takes the edge off.
29,111Thursday's low; an hourly close under it brings the fuel.
28,986.25Last week's untouched low, the floor bears are reaching for.

The Trap

After a drop this big, late shorts tend to pile in right at the lows and get squeezed by the reflex bounce. On the other side, dip-chasers grab the first green hourly bar and get run over if 29111 gives way.

Last price29,217.75
ADR · 30 sessions529.57 pts
Daily EMA2129,956.32REJECT
Reopen gapDOWN · -37.75 ptsOpen · 0.071 ADR
29,00029,20029,40029,60029,80030,00030,200close 16:00Fri 9:30close 16:00Mon 9:30close 16:00Tue 9:30close 16:00Wed 9:30close 16:00Thu 9:30close 16:00Gap fill · 29,217.75Prior week high · 30,114Prior week low · 28,986.25H1 · EMA21 · NQ / MNQ 29,217.75Yellow: 09:30 open · dashed gray: 16:00 close (ET)

The Read

Bulls pushed through 30114 on the week, could not stay there, and got thrown back to 29217.75. Thursday's daily bar was a heavy bear candle on above-average volume, closing far under its 21-period average, and the last hourly bar dropped hard into the close. The evidence clearly sides with the bears, but the day already ran well past its normal range and an overnight gap that usually fills could spark a reflex bounce. Hold under 29465 and the path toward 29024 and 28986.25 stays open; reclaim 29465 on the hourly and the bears lose their grip.

Yesterday's daily candle · Thu, Oct 29
Open29,791High29,794.25Low29,111Close29,217.75
bearish · range 683.25 pts
Projected range · next session570 pts28,870 – 29,440

Index drivers

Alphabet led the tech heavyweights lower, with Amazon, Broadcom and Nvidia also falling, and Amazon's slide came after its third-quarter results. Microsoft and Tesla slipped slightly, while Apple and Meta finished higher, the one pocket of strength in the group. No upcoming earnings dates were listed for these heavyweights.

Market data as of Oct 29, 6:33 PM EDT · Weights as of 2026-09-30

Evidence · 7 cited findings

Price action · weekly / daily / H1

  • Weekly price swept the prior-week high at 30114 without acceptance and reversed to 29217.75; support remains near 29024 and 28986.25.
  • The 2026-10-29 daily candle was bearish with a 0.839 body, closed 738.57 points below the 29956.32 EMA21 and used 1.29 ADR on 1.341 times 30-day average volume.
  • The final H1 bar expanded 481.5 points and closed at 29217.75 below its 29585.73 EMA21; continuation toward 29024 and 28986.25 is favored after any reflex bounce.
  • Recovery above 29465 would weaken the immediate bearish path.

Metrics

  • ADR30 is 529.57 points, while the completed daily range consumed 1.29 ADR, raising the chance of a corrective bounce without reversing the bearish structure.
  • The 37.75-point downside reopen gap equals 0.071 ADR; its bucket has an 87.13% same-session fill rate, a one-hour median and three-hour 80th percentile from 101 observations.
  • The forecast expansion threshold is 105 points; the strongest historical expansion hours supplied are 10:00, 09:00 and 11:00 ET.
Sources & evidence dates · 28
  1. bls.gov
  2. The Federal Reserve held the federal-funds target at 3.75%-4.00% on Oct. 28; two voters preferred a 25-basis-point increase. The statement described strong activity and elevated inflation, corroborating a hawkish policy backdrop, but it did not establish an 80%-plus probability of a December hike.2026-10-28
  3. ir.aboutamazon.com2026-10-29
  4. cnbc.com2026-10-29
  5. news.un.org2026-10-29
  6. Yahoo2026-10-29T21:43:30.000Z
  7. Yahoo2026-10-29T21:41:57.000Z
  8. Yahoo2026-10-29T21:41:36.000Z
  9. Yahoo2026-10-29T21:43:37.000Z
  10. Yahoo2026-10-29T20:55:15.000Z
  11. Yahoo2026-10-29T20:41:17.000Z
  12. Yahoo2026-10-29T17:30:00.000Z
  13. Yahoo2026-10-29T16:58:00.000Z
  14. Yahoo2026-10-29T16:06:30.000Z
  15. Yahoo2026-10-29T21:43:40.000Z
  16. Yahoo2026-10-29T21:40:02.000Z
  17. Yahoo2026-10-29T21:40:00.000Z
  18. Yahoo2026-10-29T21:35:13.000Z
  19. Yahoo2026-10-29T20:19:00.000Z
  20. Yahoo2026-10-29T20:07:00.000Z
  21. Yahoo2026-10-29T21:07:37.000Z
  22. Yahoo2026-10-29T20:13:00.000Z
  23. Yahoo2026-10-29T21:33:00.000Z
  24. Yahoo2026-10-29T21:21:34.000Z
  25. Yahoo2026-10-29T19:43:43.000Z
  26. Yahoo2026-10-29T19:06:44.000Z
  27. Yahoo2026-10-29T17:47:00.000Z
ES / MESE-mini / Micro E-mini S&P 500Weekly thesis · STRESSED

The Lines in the Sand

7,754Bears' ceiling; hourly acceptance above here cools the downside.
7,689.75Weekly open, close enough that bears can smell it.
7,651.75This week's low; losing it puts last week's floor in play.

The Trap

A close right at the session low invites fresh shorts at the worst spot, and a quick pop back toward 7754 tends to shake them out. The bulls' version is treating the weekly poke above 7811.75 as a breakout when price never held there.

Last price7,710.25
ADR · 30 sessions78.63 pts
Daily EMA217,757.93REJECT
Reopen gapNo opening gap
7,6407,6607,6807,7007,7207,7407,7607,7807,8007,820close 16:00Fri 9:30close 16:00Mon 9:30close 16:00Tue 9:30close 16:00Wed 9:30close 16:00Thu 9:30close 16:00Prior week high · 7,811.75Prior week low · 7,648.5H1 · EMA21 · ES / MES 7,710.25Yellow: 09:30 open · dashed gray: 16:00 close (ET)

The Read

Bulls poked above 7811.75 this week, found no follow-through, and slid back to 7710.25. Thursday closed near its 7709.5 low after getting rejected at the 21-period average on heavy volume, and the final hourly bar ran well beyond a normal hour's range. The evidence clearly leans to the bears, though gains in Apple, Meta and Berkshire show the damage was not across the board. Stay under 7754 and the 7689.75 weekly open is a short walk away, with 7651.75 behind it; reclaim 7754 on the hourly and the bear case loses its footing.

Yesterday's daily candle · Thu, Oct 29
Open7,767.75High7,774.5Low7,709.5Close7,710.25
bearish · range 65 pts
Projected range · next session82 pts7,660 – 7,742

Index drivers

Both Alphabet share classes led the S&P heavyweights lower, joined by Micron, Amazon and AMD, while Nvidia, Broadcom, Microsoft and Tesla also slipped. Apple, Meta and Berkshire Hathaway closed higher. No upcoming earnings dates were listed for the group.

Market data as of Oct 29, 6:33 PM EDT · Weights as of 2026-10-01

Evidence · 8 cited findings

Price action · weekly / daily / H1

  • Weekly price swept 7811.75, failed acceptance and returned to 7710.25; the failed breakout and lower-half location favor a red final session.
  • The 2026-10-29 daily candle had a 0.8846 bearish body, closed near its 7709.5 low and rejected the 7757.93 EMA21 on 1.322 times average volume.
  • The final H1 bar expanded 48.5 points and closed at 7710.25 below its 7749.38 EMA21; continuation toward 7689.75 and 7651.75 is favored.
  • A sustained reclaim above 7754 would weaken the immediate bearish path.

Metrics

  • ADR30 is 78.63 points and the completed daily range used 0.827 ADR, leaving more measured range capacity than MNQ.
  • The H1 expansion threshold is 18.5 points; the final 48.5-point range exceeded it materially.
  • The strongest supplied expansion hours are 10:00, 11:00 and 09:00 ET.

Sentiment & current events

  • SPY driver evidence showed both GOOGL share classes down more than 12%, AMZN down 4.2459%, MU down 4.9795% and AMD down 2.078%; AAPL and META gains are the strongest contradiction: https://www.ssga.com/us/en/intermediary/etfs/state-street-spdr-sp-500-etf-trust-spy
Sources & evidence dates · 35
  1. bls.gov
  2. The Federal Reserve held the federal-funds target at 3.75%-4.00% on Oct. 28; two voters preferred a 25-basis-point increase. The statement described strong activity and elevated inflation, corroborating a hawkish policy backdrop, but it did not establish an 80%-plus probability of a December hike.2026-10-28
  3. ir.aboutamazon.com2026-10-29
  4. cnbc.com2026-10-29
  5. news.un.org2026-10-29
  6. Yahoo2026-10-29T21:43:30.000Z
  7. Yahoo2026-10-29T21:41:57.000Z
  8. Yahoo2026-10-29T21:41:36.000Z
  9. Yahoo2026-10-29T21:43:37.000Z
  10. Yahoo2026-10-29T20:55:15.000Z
  11. Yahoo2026-10-29T20:41:17.000Z
  12. Yahoo2026-10-29T17:30:00.000Z
  13. Yahoo2026-10-29T16:58:00.000Z
  14. Yahoo2026-10-29T16:06:30.000Z
  15. Yahoo2026-10-29T21:43:40.000Z
  16. Yahoo2026-10-29T21:40:02.000Z
  17. Yahoo2026-10-29T21:40:00.000Z
  18. Yahoo2026-10-29T21:35:13.000Z
  19. Yahoo2026-10-29T20:19:00.000Z
  20. Yahoo2026-10-29T20:07:00.000Z
  21. Yahoo2026-10-29T21:07:37.000Z
  22. Yahoo2026-10-29T20:13:00.000Z
  23. Yahoo2026-10-29T21:33:00.000Z
  24. Yahoo2026-10-29T21:21:34.000Z
  25. Yahoo2026-10-29T19:43:43.000Z
  26. Yahoo2026-10-29T19:06:44.000Z
  27. Yahoo2026-10-29T17:47:00.000Z
  28. Yahoo2026-10-29T20:45:03.000Z
  29. Yahoo2026-10-29T20:26:05.000Z
  30. Yahoo2026-10-29T19:14:00.000Z
  31. Yahoo2026-10-29T19:50:00.000Z
  32. Yahoo2026-10-29T19:44:00.000Z
  33. Yahoo2026-10-29T06:28:34.000Z
  34. Yahoo2026-10-28T22:40:00.000Z
GC / MGCGold / Micro GoldWeekly thesis · STRESSED

The Lines in the Sand

4,050Top of the box; an hourly close above shifts momentum up.
4,015Bottom of the box; an hourly close under tips it down.
3,989Last week's low, the floor nobody has touched yet.

The Trap

Inside a tight box, both sides get chopped up chasing every push toward the edges. The tell is an hourly close outside 4015 or 4050; moves that only poke through tend to snap back.

Last price4,033.3
ADR · 30 sessions73.64 pts
Daily EMA214,142.15REJECT
Reopen gapNo opening gap
4,0004,0204,0404,0604,0804,100close 13:30Fri 8:20close 13:30Mon 8:20close 13:30Tue 8:20close 13:30Wed 8:20close 13:30Thu 8:20close 13:30Prior week low · 3,989H1 · EMA21 · GC / MGC 4,033.3Yellow: 08:20 open · dashed gray: 13:30 close (ET)

The Read

Gold bulls and bears have fought to a standstill. The daily bar got slapped down from the 4142.15 average and closed weak, yet the 4015.8 low held above last week's 3989 floor and price clawed back to 4033.3. Record ETF holdings back the longer-term bid, but big speculators cut their net long hard in September and a hawkish Fed hold, with two voters wanting a hike, is a headwind. The tilt is only slightly upward and the evidence is thin: an hourly close above 4050 opens the door toward 4083, while an hourly close under 4015 leaves 3989 exposed.

Yesterday's daily candle · Thu, Oct 29
Open4,081High4,083Low4,015.8Close4,033.3
bearish · range 67.2 pts
Projected range · next session62 pts4,008 – 4,070
⚠ Flat / choppy conditions likely
Evidence · 12 cited findings

Price action · weekly / daily / H1

  • Weekly structure remains modestly bullish above the 4012.1 open and 4009.5 prior close, but repeated support near 3989-4015 and resistance at 4083-4097 prevent directional conviction.
  • The daily candle rejected the 4142.15 EMA21 and closed bearish with a 0.7098 body, but its 4015.8 low held above the 3989 prior-week low and price recovered from the extreme.
  • H1 closed at 4033.3 just below its 4038.34 EMA21 after rebounding from 4015.8; rotation between 4015 and 4050 is favored until an hourly close escapes that range.
  • The projected candle remains internally flat-to-green, opening near 4034 and closing near 4046 inside a 4008-4070 range.

Metrics

  • ADR30 is 73.64 points and the daily range consumed 0.913 ADR.
  • The final H1 range was 13.6 points, below the 23.9-point expansion threshold, with 15 bars since the last expansion.
  • The strongest supplied expansion hours are 10:00, 09:00 and 21:00 ET.
  • No current reopen gap exists; a historical open gap at 4320.7 is outside the 12-hour forecast thesis.
  • Primary-feed verification was unavailable for supplied futures levels and calculations.

Sentiment & current events

  • The Fed's 3.75%-4.00% hold with two hike-preferring dissents creates a hawkish headwind for gold: https://www.federalreserve.gov/newsevents/pressreleases/monetary20261028a.htm
  • World Gold Council data show record ETF holdings of 4,256 tonnes after September inflows of $10 billion and 67 tonnes, providing structural support: https://www.gold.org/goldhub/research/gold-etfs-holdings-and-flows/2026/10
  • The strongest contradiction is the same World Gold Council report's 84-tonne fall in September COMEX managed-money net length to 387 tonnes, which conflicts with the structural ETF-demand signal: https://www.gold.org/goldhub/research/gold-etfs-holdings-and-flows/2026/10
Sources & evidence dates · 5
  1. bls.gov
  2. The Federal Reserve held the federal-funds target at 3.75%-4.00% on Oct. 28; two voters preferred a 25-basis-point increase. The statement described strong activity and elevated inflation, corroborating a hawkish policy backdrop, but it did not establish an 80%-plus probability of a December hike.2026-10-28
  3. World Gold Council confirms September gold-ETF inflows of $10 billion and 67 tonnes, lifting holdings to a record 4,256 tonnes. It also reports September COMEX managed-money net length fell by 84 tonnes to 387 tonnes, a material short-term flow contradiction to the structural ETF-demand thesis.2026-10-07
  4. news.un.org2026-10-29
  5. gold.org2026-10-07
CL / MCLWTI Crude Oil / Micro WTI Crude OilWeekly thesis · FULFILLED

The Lines in the Sand

103.93Last week's high, the lid crude has not cracked.
101.7Hourly support; sustained trade under it saps the push.
99.44This week's low, where bulls dug in and held.

The Trap

Late bulls tend to chase into the 103.55 to 103.93 ceiling and get caught when it rejects again. Bears fading a quiet hourly bar near the highs risk the same squeeze that ran from 99.8.

Last price102.87
ADR · 30 sessions3.7 pts
Daily EMA2196.67HOLD
Reopen gapNo opening gap
99100101102103104close 14:30Fri 9:00close 14:30Mon 9:00close 14:30Tue 9:00close 14:30Wed 9:00close 14:30Thu 9:00close 14:30Prior week high · 103.93H1 · EMA21 · CL / MCL 102.87Yellow: 09:00 open · dashed gray: 14:30 close (ET)

The Read

Crude bulls defended 99.44 on the week and dragged price back to 102.87, but 103.55 to 103.93 is still a wall they have not broken. Thursday's bar recovered from 99.8 on more than double the usual volume and closed well above its 21-period average. Government data showed crude and distillate stockpiles drawing down with refineries running hard, but a gasoline build and softer fuel demand are the counterweight. The lean is up, not a lock: an hourly close above 103 brings the fuel for another run at 103.93, while sustained trade below 101.7 cuts the legs out from under it.

Yesterday's daily candle · Thu, Oct 29
Open101.95High103Low99.8Close102.87
bullish · range 3.2 pts
Projected range · next session2.5 pts101.75 – 104.25
Evidence · 12 cited findings

Price action · weekly / daily / H1

  • Weekly price is holding above the 102.55 open after defending 99.44, but 103.55-103.93 remains unresolved resistance; another upside test is favored without assuming a breakout.
  • The daily candle recovered from 99.8 to close at 102.87, held well above the 96.67 EMA21 and traded on 2.338 times average volume.
  • H1 advanced from 99.8 through higher closes and finished at 102.87 above its 101.70 EMA21 near the 103 high.
  • The final 0.26-point H1 range was not expansive, so consolidation may precede renewed strength; an hourly close above 103 confirms the expansion condition.

Metrics

  • ADR30 is 3.70 and the completed daily range consumed 0.865 ADR.
  • The H1 expansion threshold is 0.82, while the final completed range was 0.26.
  • The strongest supplied expansion hours are 10:00, 09:00 and 11:00 ET.
  • No current reopen gap is present; historical gaps at 79.94 and 85.16 are outside the 12-hour thesis.
  • Primary futures-feed verification was unavailable for supplied prices, EMA values and volume calculations.

Sentiment & current events

  • EIA reported a 1.9-million-barrel commercial crude draw to 410.6 million barrels, 4% below the five-year average, and a 1.5-million-barrel distillate draw: https://www.eia.gov/petroleum/supply/weekly/archive/2026/2026_10_28/download/summary.txt
  • Four-week refinery inputs averaged 16.567 million barrels per day with 93.1% utilization, supporting refinery demand: https://www.eia.gov/petroleum/supply/weekly/pdf/highlights.pdf
  • IEA documented disruption-driven tightness and impaired Russian and Middle Eastern refining, but its October report is backward-looking and does not verify real-time October 29 transit conditions: https://www.iea.org/reports/oil-market-report-october-2026
Sources & evidence dates · 5
  1. eia.gov2026-10-28
  2. eia.gov2026-10-28
  3. iea.org2026-10-10
  4. news.un.org2026-10-29
  5. eia.gov2026-10-28

Free. Always. Futures trading edge in your inbox.

You're in. Watch your inbox.

We do not send junk mail. We do not spam.