Session Prep

Two minutes tonight. A plan tomorrow.
Evening edition · Data as of Wed, Oct 28, 5:00 PM EDT · All times Eastern
Deep research

Tonight's one thing

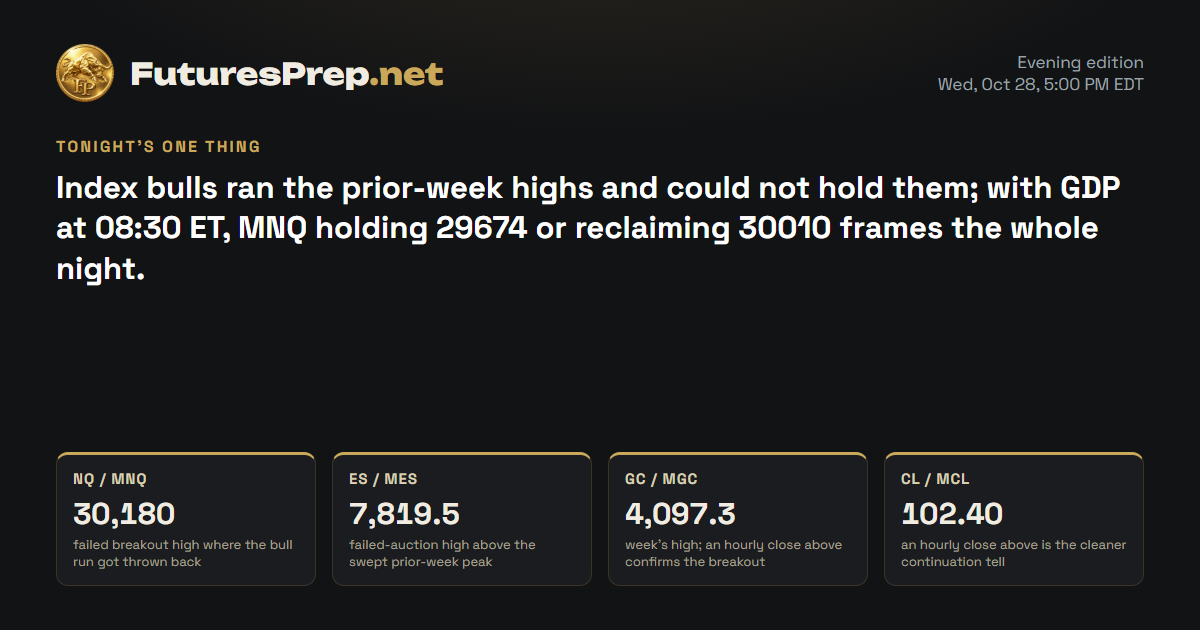
Index bulls ran the prior-week highs and could not hold them; with GDP at 08:30 ET, MNQ holding 29674 or reclaiming 30010 frames the whole night.

Tomorrow's market movers · Thursday, October 29

Time ETImpactEventForecastPrevious
8:30 AMHighAdvance GDP q/q3.2%1.5%
8:30 AMHighCore PCE Price Index m/m0.3%0.2%
8:30 AMMediumAdvance GDP Price Index q/q3.2%6.2%
8:30 AMMediumUnemployment Claims198K194K

U.S. releases, high and medium impact.

NQ / MNQE-mini / Micro E-mini Nasdaq-100Weekly thesis · STRESSED

The Lines in the Sand

30,180failed breakout high where the bull run got thrown back
30,010reclaim it and the bear case loses its teeth
29,674session low; acceptance below opens the trapdoor

The Trap

The sweep of 30114 pulled in breakout chasers who are now offside under 30180. The other half of the trap is late shorts piling in near 29674 just ahead of an 08:30 ET data print that can whip the tape both ways.

Last price29,755
ADR · 30 sessions524.98 pts
Daily EMA2130,030.18REJECT
Reopen gapUP · 36 ptsFilled
29,00029,20029,40029,60029,80030,00030,200close 16:00Thu 9:30close 16:00Fri 9:30close 16:00Mon 9:30close 16:00Tue 9:30close 16:00Wed 9:30close 16:00Prior week high · 30,114Prior week low · 28,986.25H1 · EMA21 · NQ / MNQ 29,755Yellow: 09:30 open · dashed gray: 16:00 close (ET)

The Read

Bulls punched through the 30114 prior-week high, tagged 30180, and got thrown back 506 points to close at 29755. The daily candle printed a heavier-than-usual-volume doji and closed well under its 30030.18 average, which leaves the breakout chasers offside. The bears' missing tell is follow-through: there is still no acceptance under 29674. The strongest counter is the weekly candle, still green from 29268.50 with two sessions left. Lose 29674 and the floor gives way; reclaim 30010 and the bearish tilt fades, while acceptance over 30180 erases the failed-breakout story entirely.

Yesterday's daily candle · Wed, Oct 28
Open29,815.75High30,180Low29,674Close29,755
doji · range 506 pts
Projected range · next session445 pts29,490 – 29,935

Index drivers

Heavyweights split at the cash close: Nvidia, Apple, Meta and Tesla slipped and Microsoft barely moved, while Broadcom, Alphabet and Amazon finished higher. After the bell, a headline reported Alphabet shares falling on a profit miss and ad slowdown, which carries that risk into the overnight session. No upcoming earnings dates were listed for these names.

Market data as of Oct 28, 6:33 PM EDT · Weights as of 2026-09-30

Evidence · 11 cited findings

Price action · weekly / daily / H1

  • Weekly price is green from 29268.50 and swept the 30114 prior-week high, but failure to accept above it and rejection from 30180 create a failed-breakout profile.
  • The daily candle was a high-volume doji after using 0.964 ADR; it rejected the 30030.18 EMA21 and closed 275.18 points below it at 29755.
  • H1 reversed from 30180 to 29755 in a 506-point expansion and closed below its 29856.46 EMA21; bearish continuation requires acceptance below 29674.
  • Reclaiming 30010 would weaken the bearish scenario, while 30180 remains the failed-auction high.
  • The projected path is 29820 at 20:00, 29710 at 02:00 and 29590 at 06:00 ET, with a scenario candle of 29755/29935/29490/29620.

Metrics

  • The completed daily range was 506 points versus 524.98 ADR, using 96.4% of normal range.
  • Daily volume was 1.14 times its 30-session average, adding weight to the rejection but not resolving the doji by itself.
  • The H1 expansion threshold is 105 points and the latest completed bar measured 506 points.
  • A 36-point reopening gap referenced 29755 and was already filled; its bucket has an 87.13% same-session fill rate across 101 observations.

Sentiment & current events

  • Post-close reporting included a headline saying Alphabet shares fell after a profit miss and advertising slowdown, creating event risk beyond the cash close (https://finnhub.io/api/news?id=1531f7755665caf7b8c1baff5942832bbd9df37ecc4d8ee753ea3b92b2f2ae20).
  • No authoritative post-FOMC snapshot of yields, DXY, VIX, policy probabilities or options skew was verified.
Sources & evidence dates · 29
  1. federalreserve.gov2026-10-28T14:00:00-04:00
  2. bea.gov
  3. bls.gov2026-10-14T08:30:00-04:00
  4. bls.gov2026-10-02T08:30:00-04:00
  5. cftc.gov2026-10-23
  6. tradingview.com2026-10-27T00:00:00-04:00
  7. Yahoo2026-10-28T21:40:00.000Z
  8. Yahoo2026-10-28T21:28:44.000Z
  9. Yahoo2026-10-28T21:25:35.000Z
  10. Yahoo2026-10-28T21:57:02.000Z
  11. Yahoo2026-10-28T21:44:38.000Z
  12. Yahoo2026-10-28T21:34:30.000Z
  13. Yahoo2026-10-28T20:58:00.000Z
  14. Yahoo2026-10-28T19:46:45.000Z
  15. Yahoo2026-10-28T19:30:47.000Z
  16. Yahoo2026-10-28T21:01:00.000Z
  17. Yahoo2026-10-28T19:59:25.000Z
  18. Yahoo2026-10-28T21:26:25.000Z
  19. Yahoo2026-10-28T21:04:03.000Z
  20. Yahoo2026-10-28T20:57:02.000Z
  21. Yahoo2026-10-28T20:45:03.000Z
  22. Yahoo2026-10-28T18:24:00.000Z
  23. Yahoo2026-10-28T16:54:00.000Z
  24. Yahoo2026-10-28T21:38:01.000Z
  25. Yahoo2026-10-28T21:37:18.000Z
  26. Yahoo2026-10-28T20:15:00.000Z
  27. Yahoo2026-10-28T19:57:00.000Z
  28. Yahoo2026-10-28T19:08:00.000Z
ES / MESE-mini / Micro E-mini S&P 500Weekly thesis · STRESSED

The Lines in the Sand

7,819.5failed-auction high above the swept prior-week peak
7,785an hourly close above tips the balance to bulls
7,750.5session low; an hourly close below hands bears control

The Trap

The poke above 7811.75 lured breakout chasers, who were left holding the bag once price fell back under it. On a doji day like this, the tape tends to whipsaw both sides between 7750.50 and 7785 before either earns follow-through.

Last price7,760.75
ADR · 30 sessions79.96 pts
Daily EMA217,762.7REJECT
Reopen gapUP · 7 ptsFilled
7,6407,6607,6807,7007,7207,7407,7607,7807,8007,820close 16:00Thu 9:30close 16:00Fri 9:30close 16:00Mon 9:30close 16:00Tue 9:30close 16:00Wed 9:30close 16:00Prior week high · 7,811.75Prior week low · 7,648.5H1 · EMA21 · ES / MES 7,760.75Yellow: 09:30 open · dashed gray: 16:00 close (ET)

The Read

Bulls took out the 7811.75 prior-week high, tagged 7819.50, and got shoved straight back into the range. The day closed as a near-perfect doji at 7760.75, almost on top of its 7762.70 average, on ordinary volume: nobody won the fight. The strongest tension is the green weekly candle against the failed hold above 7811.75. An hourly close below 7750.50 opens the floor for bears; an hourly close above 7785 hands bulls the door. Between those two, there is no clean edge, and the 08:30 ET GDP data is the likely fuse.

Yesterday's daily candle · Wed, Oct 28
Open7,761.5High7,819.5Low7,750.5Close7,760.75
doji · range 69 pts
Projected range · next session53.75 pts7,738.5 – 7,792.25
⚠ Flat / choppy conditions likely

Index drivers

S&P heavyweights split: Nvidia, Apple, Meta, Tesla and Berkshire Hathaway slipped and Microsoft was nearly flat, while Micron, AMD and Broadcom rallied alongside Alphabet and Amazon. After the close, headlines showed earnings reactions pulling in different directions, with Microsoft rising late and Alphabet falling. No upcoming earnings dates were listed for these names.

Market data as of Oct 28, 6:33 PM EDT · Weights as of 2026-10-01

Evidence · 11 cited findings

Price action · weekly / daily / H1

  • Weekly structure is green from 7689.75 and swept the 7811.75 prior-week high, but the close back below it leaves 7819.50 as failed-auction resistance.
  • The daily candle was an almost exact doji after 0.863 ADR and closed only 1.95 points below the 7762.70 EMA21, showing balance.
  • H1 expanded 69 points from 7819.50 to 7750.50 and closed below its 7765.36 EMA21.
  • Near-term balance is defined by 7750.50 support and 7785 resistance; downside expansion requires an hourly close below support.
  • The projected path is 7768 at 20:00, 7756 at 02:00 and 7764 at 06:00 ET, with a scenario candle of 7760.75/7792.25/7738.50/7756.25.

Metrics

  • The daily range was 69 points versus 79.96 ADR, using 86.3% of normal range.
  • Daily volume was 1.03 times its 30-session average, offering no material volume skew.
  • The H1 expansion threshold is 18.5 points and the latest completed range measured 69 points.
  • A seven-point reopening gap referenced 7760.75 and was already filled; its bucket has a 93.62% same-session fill rate across 94 observations.

Sentiment & current events

  • Post-close headlines reported divergent reactions across Microsoft and Alphabet-related earnings, increasing overnight dispersion (https://finnhub.io/api/news?id=7d0657df8f92023442fe524cbc7163fd485d0a7b262edc5f2a9ebf7af0b7fb75).
  • No authoritative post-FOMC yields, DXY, VIX, policy-probability or options-skew snapshot was verified.
Sources & evidence dates · 36
  1. federalreserve.gov2026-10-28T14:00:00-04:00
  2. bea.gov
  3. bls.gov2026-10-14T08:30:00-04:00
  4. bls.gov2026-10-02T08:30:00-04:00
  5. tradingview.com2026-10-27T00:00:00-04:00
  6. Yahoo2026-10-28T21:40:00.000Z
  7. Yahoo2026-10-28T21:28:44.000Z
  8. Yahoo2026-10-28T21:25:35.000Z
  9. Yahoo2026-10-28T21:57:02.000Z
  10. Yahoo2026-10-28T21:44:38.000Z
  11. Yahoo2026-10-28T21:34:30.000Z
  12. Yahoo2026-10-28T20:58:00.000Z
  13. Yahoo2026-10-28T19:46:45.000Z
  14. Yahoo2026-10-28T19:30:47.000Z
  15. Yahoo2026-10-28T21:01:00.000Z
  16. Yahoo2026-10-28T19:59:25.000Z
  17. Yahoo2026-10-28T21:26:25.000Z
  18. Yahoo2026-10-28T21:04:03.000Z
  19. Yahoo2026-10-28T20:57:02.000Z
  20. Yahoo2026-10-28T20:45:03.000Z
  21. Yahoo2026-10-28T18:24:00.000Z
  22. Yahoo2026-10-28T16:54:00.000Z
  23. Yahoo2026-10-28T21:38:01.000Z
  24. Yahoo2026-10-28T21:37:18.000Z
  25. Yahoo2026-10-28T20:15:00.000Z
  26. Yahoo2026-10-28T19:57:00.000Z
  27. Yahoo2026-10-28T19:08:00.000Z
  28. Yahoo2026-10-28T21:48:59.000Z
  29. Yahoo2026-10-28T20:59:51.000Z
  30. Yahoo2026-10-28T20:20:52.000Z
  31. Yahoo2026-10-28T18:43:00.000Z
  32. Yahoo2026-10-28T18:20:00.000Z
  33. Yahoo2026-10-28T10:30:02.000Z
  34. Yahoo2026-10-28T09:26:01.000Z
  35. Yahoo2026-10-28T00:39:58.000Z
GC / MGCGold / Micro GoldWeekly thesis · STRESSED

The Lines in the Sand

4,097.3week's high; an hourly close above confirms the breakout
4,060lose it and the rebound slides back into balance
4,153.04daily average overhead that already turned price away

The Trap

Gold flushed to 4037.30 and snapped back, catching late shorts offside. The flip side is chasing strength into 4097.30 on light volume, which tends to get rejected while price still sits well under its daily average.

Last price4,081.5
ADR · 30 sessions75.67 pts
Daily EMA214,153.04REJECT
Reopen gapNo opening gap
3,9804,0004,0204,0404,0604,0804,1004,1204,1404,1604,180close 13:30Thu 8:20close 13:30Fri 8:20close 13:30Mon 8:20close 13:30Tue 8:20close 13:30Wed 8:20close 13:30Prior week low · 3,989H1 · EMA21 · GC / MGC 4,081.5Yellow: 08:20 open · dashed gray: 13:30 close (ET)

The Read

Bears broke gold down to 4037.30, then bulls took it back, closed it at 4081.50 and reclaimed the hourly average at 4061.07. That recovery tilts the night modestly toward bulls, with September ETF inflows as structural fuel in the background. The counter is loud: the daily candle stayed under the 4153.04 average and was rejected there, and volume ran light. An hourly close above 4097.30 opens the door toward the 4120-4140 zone; lose 4060 and the bounce drifts back into balance.

Yesterday's daily candle · Wed, Oct 28
Open4,075.1High4,097.3Low4,037.3Close4,081.5
doji · range 60 pts
Projected range · next session77.6 pts4,054.2 – 4,131.8
Evidence · 12 cited findings

Price action · weekly / daily / H1

  • Weekly structure is green from 4012.10, remains above the 4009.50 prior close and has not swept either prior-week extreme; 4097.30 is the immediate breakout boundary.
  • The daily candle remained below and rejected the 4153.04 EMA21, but buyers recovered the breakdown from 4037.30 and produced a doji close at 4081.50.
  • H1 reclaimed its 4061.07 EMA21 and closed at 4081.50 after the 14:00-16:00 volatility burst.
  • An hourly close above 4097.30 favors continuation toward the already identified 4120-4140 zone; loss of 4060 restores balance.
  • The projected path is 4074 at 20:00, 4092 at 02:00 and 4112 at 06:00 ET, with a scenario candle of 4081.50/4131.80/4054.20/4114.60.

Metrics

  • The daily range was 60 points versus 75.67 ADR, using 79.3% of normal range.
  • Daily volume was 0.837 times its 30-session average, limiting confirmation of the recovery.
  • The close remained 71.54 points, or 0.945 ADR, below the daily EMA21.
  • The H1 expansion threshold is 23.9 points and the latest completed range measured 27.6 points.
  • There is no current-session gap; the distant 4320.70 downside-gap inventory is not applicable to this forecast window.

Sentiment & current events

  • World Gold Council reported September ETF inflows of $10 billion and 67 tonnes, with holdings at 4,256 tonnes; this is structural support rather than proof of overnight direction (https://www.gold.org/goldhub/research/gold-etfs-holdings-and-flows/2026/10).
  • Restrictive policy and possible real-rate pressure oppose structural ETF demand, but no current yield or dollar snapshot was verified.
Sources & evidence dates · 7
  1. federalreserve.gov2026-10-28T14:00:00-04:00
  2. bea.gov
  3. bls.gov2026-10-14T08:30:00-04:00
  4. bls.gov2026-10-02T08:30:00-04:00
  5. gold.org2026-10-07
  6. reddit.com2026-10-26T00:00:00-04:00
CL / MCLWTI Crude Oil / Micro WTI Crude OilWeekly thesis · STRESSED

The Lines in the Sand

102.4an hourly close above is the cleaner continuation tell
100.93an hourly close below breaks the rebound premise
103.55event-driven spike high where bulls got rejected

The Trap

Crude ran hot on heavy volume, then got slapped down from 103.55, the classic spot where late bulls chase the spike and end up offside. Shorts who faded too early into the 100.93-101.50 support zone have also been caught by the rebound.

Last price101.94
ADR · 30 sessions3.67 pts
Daily EMA2196.05HOLD
Reopen gapNo opening gap
96979899100101102103104close 14:30Thu 9:00close 14:30Fri 9:00close 14:30Mon 9:00close 14:30Tue 9:00close 14:30Wed 9:00close 14:30Prior week high · 103.93H1 · EMA21 · CL / MCL 101.94Yellow: 09:00 open · dashed gray: 14:30 close (ET)

The Read

Bulls drove crude from 99.74 to 103.55 on heavy volume and closed at 101.94, well above the 96.05 daily average. A reported crude inventory draw adds fuel on the bull side. The tell against it is the rejection from 103.55 and a two-hour pullback, with exhaustion risk after a full-range day. If the 100.93-101.50 zone holds and an hourly close lands above 102.40, the door opens; an hourly close below 100.93 and the rebound case is gone.

Yesterday's daily candle · Wed, Oct 28
Open100.2High103.55Low99.74Close101.94
bullish · range 3.81 pts
Projected range · next session3.33 pts100.72 – 104.05
Evidence · 13 cited findings

Price action · weekly / daily / H1

  • Weekly price remains inside the prior-week range and below the 103.43 prior close, leaving the broader weekly candle flat despite holding above 99.44.
  • The daily candle was bullish, used 1.04 ADR and closed at 101.94, 5.89 points above the 96.05 EMA21, on 2.966 times average volume.
  • H1 pulled back for two hours from 103.55 and closed near its 101.90 EMA21.
  • Holding 100.93-101.50 supports a rebound, while an hourly close above 102.40 is the cleaner continuation trigger.
  • The projected path is 101.65 at 20:00, 102.18 at 02:00 and 102.78 at 06:00 ET, with a scenario candle of 101.94/104.05/100.72/103.18.

Metrics

  • The daily range was 3.81 points versus 3.67 ADR, using 104% of normal range.
  • Daily volume was 2.966 times its 30-session average, strongly confirming participation but also raising exhaustion risk.
  • The daily close was 1.606 ADR above its EMA21.
  • The H1 expansion threshold is 0.82 and the latest completed range measured 1.16.
  • There is no current-session gap; old open gaps at 79.94 and 85.16 are not applicable to this window.

Sentiment & current events

  • Current reporting on the October 28 EIA release identified a 1.9-million-barrel commercial crude draw to about 410.6 million barrels (https://www.ogj.com/general-interest/economics-markets/news/55415055/eia-us-crude-oil-inventories-down-19-million-bbl).
  • The older EIA report for the week ended October 16 is superseded and excluded from current direction (https://www.eia.gov/petroleum/supply/weekly/archive/2026/2026_10_21/download/summary.txt).
  • The complete October 28 primary EIA tables were not extracted, leaving product stocks, imports, exports, refinery utilization and demand details incomplete.
Sources & evidence dates · 9
  1. federalreserve.gov2026-10-28T14:00:00-04:00
  2. bea.gov
  3. bls.gov2026-10-14T08:30:00-04:00
  4. bls.gov2026-10-02T08:30:00-04:00
  5. eia.gov2026-10-21
  6. Current reporting on the October 28 EIA release identifies a 1.9-million-barrel commercial crude draw to approximately 410.6 million barrels. This supersedes the older October 16 balance, although the complete primary EIA table was not independently extracted during this check.2026-10-28
  7. forexfactory.com2026-10-27
  8. reddit.com2026-10-26T00:00:00-04:00

Free. Always. Futures trading edge in your inbox.

You're in. Watch your inbox.

We do not send junk mail. We do not spam.