Session Prep

Two minutes tonight. A plan tomorrow.
Morning review · Data as of Thu, Oct 29, 7:00 AM EDT · All times Eastern
Deep research

This morning's one thing

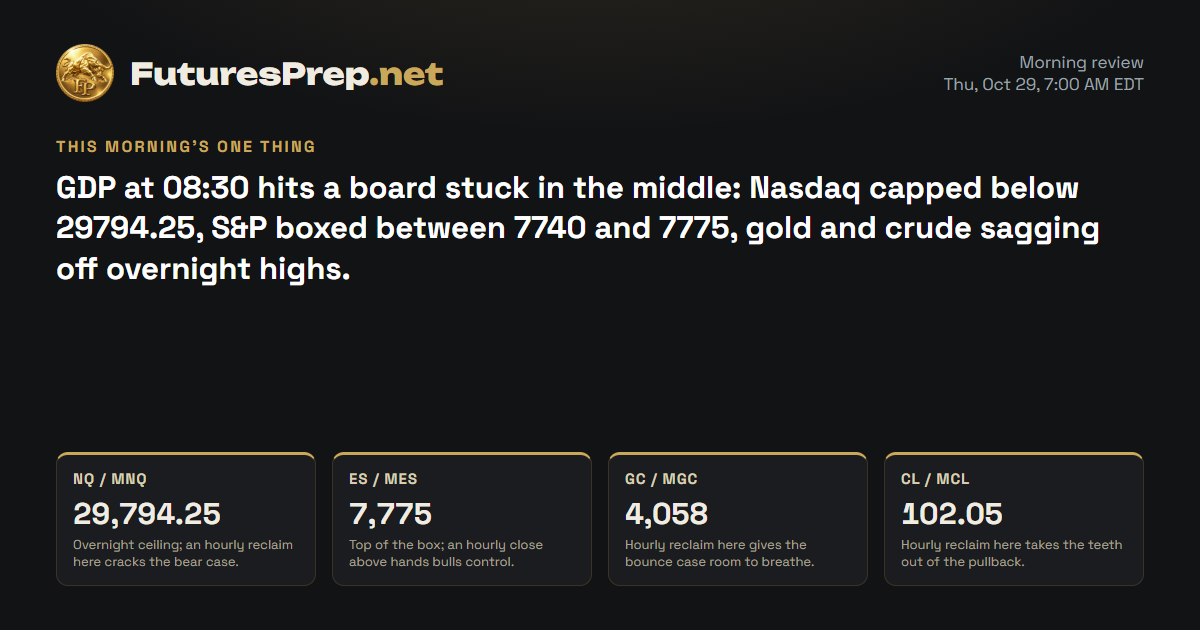
GDP at 08:30 hits a board stuck in the middle: Nasdaq capped below 29794.25, S&P boxed between 7740 and 7775, gold and crude sagging off overnight highs.

Today's market movers · Thursday, October 29

Time ETImpactEventForecastPrevious
8:30 AMHighAdvance GDP q/q3.2%1.5%
8:30 AMHighCore PCE Price Index m/m0.3%0.2%
8:30 AMMediumAdvance GDP Price Index q/q3.2%6.2%
8:30 AMMediumUnemployment Claims198K194K

U.S. releases, high and medium impact.

NQ / MNQE-mini / Micro E-mini Nasdaq-100Weekly thesis · STRESSED

The Lines in the Sand

29,794.25Overnight ceiling; an hourly reclaim here cracks the bear case.
29,483.25Overnight floor where dip demand finally showed up.
30,180Weekly high where the breakout failed and reversed hard.

The Trap

Breakout chasers who piled in above 30114 got left holding the bag when price reversed from 30180. The overnight bounce sets up the same way: it looks like strength, but it sits barely above the hourly average and still under 29794.25.

Last price29,718.25
ADR · 30 sessions524.98 pts
Daily EMA2130,030.18BELOW
Reopen gapUP · 36 ptsFilled
29,00029,20029,40029,60029,80030,00030,200Thu 9:30close 16:00Fri 9:30close 16:00Mon 9:30close 16:00Tue 9:30close 16:00Wed 9:30close 16:00Prior week high · 30,114Prior week low · 28,986.25H1 · EMA21 · NQ / MNQ 29,718.25Dashed: last night's path
Overnight: held

The Read

Bulls punched through the 30114 prior-week high, tagged 30180, and got thrown back 506 points to close at 29755. The daily candle printed a heavier-than-usual-volume doji and closed well under its 30030.18 average, which leaves the breakout chasers offside. The bears' missing tell is follow-through: there is still no acceptance under 29674. The strongest counter is the weekly candle, still green from 29268.50 with two sessions left. Lose 29674 and the floor gives way; reclaim 30010 and the bearish tilt fades, while acceptance over 30180 erases the failed-breakout story entirely.

Morning review · Oct 29, 7:30 AM EDT

Bears hold the daily chart, bulls still hold the week. Price swept the prior-week high at 30114, couldn't stay there, reversed from 30180, then dropped to 29483.25 overnight before bouncing to 29718.25. The counter-argument is real: the weekly candle is still green, lagged positioning is heavily net long, and GDP at 08:30 can overrule everything. Stay capped under 29794.25 and 29483.25 comes back into play; reclaim and hold above it hourly and the bear case loses its teeth.

Overnight evidence · 15 cited findings

Overnight price action

  • From the evening baseline, price traded 29794.25-29483.25 and finished the 06:00 bar at 29718.25.
  • The prior 29755 gap level was filled during the overnight session.
  • The evening path expected 29820, 29710 and 29590; actual price moved below the projected low region before recovering.
  • Price did not cross or close through the 30114 weekly invalidation.
  • The H1-boundary approximation is a stated limitation of the overnight measurement.

Overnight events

  • No verified unscheduled event was established as the cause of the overnight decline.
  • GDP remained pending for 08:30 ET at the data cutoff (https://www.cmegroup.com/education/events/econoday/667062).
  • The seven-year Treasury auction remained a later-session rate catalyst (https://www.treasurydirect.gov/auctions/auction-announcements/).
  • Technology-driver headlines were secondary context and did not override observed price action.
  • Exact exchange-certified prices and real-time order flow were unavailable.

What changed

  • Price action preserves the prior bearish direction.
  • Daily and weekly failed-acceptance metrics support the bearish verdict.
  • The recovery to the H1 EMA21 and green weekly candle oppose immediate continuation.
  • GDP event risk and mixed heavyweight breadth keep sentiment neutral.
  • Net result: unchanged, with downside expansion conditional on an hourly close below 29640.
Yesterday's daily candle · Wed, Oct 28
Open29,815.75High30,180Low29,674Close29,755
doji · range 506 pts
Projected range · next session445 pts29,490 – 29,935

Index drivers

Heavyweights closed mixed at the prior cash close: Nvidia, Apple, Meta and Tesla finished lower, and Microsoft barely slipped. Broadcom, Alphabet and Amazon finished higher. No upcoming earnings dates are listed for any of them.

Market data as of Oct 29, 7:33 AM EDT · Weights as of 2026-09-30

Evidence · 11 cited findings

Price action · weekly / daily / H1

  • Weekly price is green from 29268.50 and swept the 30114 prior-week high, but failure to accept above it and rejection from 30180 create a failed-breakout profile.
  • The daily candle was a high-volume doji after using 0.964 ADR; it rejected the 30030.18 EMA21 and closed 275.18 points below it at 29755.
  • H1 reversed from 30180 to 29755 in a 506-point expansion and closed below its 29856.46 EMA21; bearish continuation requires acceptance below 29674.
  • Reclaiming 30010 would weaken the bearish scenario, while 30180 remains the failed-auction high.
  • The projected path is 29820 at 20:00, 29710 at 02:00 and 29590 at 06:00 ET, with a scenario candle of 29755/29935/29490/29620.

Metrics

  • The completed daily range was 506 points versus 524.98 ADR, using 96.4% of normal range.
  • Daily volume was 1.14 times its 30-session average, adding weight to the rejection but not resolving the doji by itself.
  • The H1 expansion threshold is 105 points and the latest completed bar measured 506 points.
  • A 36-point reopening gap referenced 29755 and was already filled; its bucket has an 87.13% same-session fill rate across 101 observations.

Sentiment & current events

  • Post-close reporting included a headline saying Alphabet shares fell after a profit miss and advertising slowdown, creating event risk beyond the cash close (https://finnhub.io/api/news?id=1531f7755665caf7b8c1baff5942832bbd9df37ecc4d8ee753ea3b92b2f2ae20).
  • No authoritative post-FOMC snapshot of yields, DXY, VIX, policy probabilities or options skew was verified.
Sources & evidence dates · 26
  1. federalreserve.gov2026-10-28T14:00:00-04:00
  2. bea.gov
  3. bls.gov2026-10-14T08:30:00-04:00
  4. bls.gov2026-10-02T08:30:00-04:00
  5. cftc.gov2026-10-23
  6. tradingview.com2026-10-27T00:00:00-04:00
  7. Yahoo2026-10-29T09:34:31.000Z
  8. Yahoo2026-10-29T09:33:00.000Z
  9. Yahoo2026-10-29T09:26:02.000Z
  10. Yahoo2026-10-29T09:29:39.000Z
  11. Yahoo2026-10-29T09:28:10.000Z
  12. Yahoo2026-10-29T09:25:00.000Z
  13. SeekingAlpha2026-10-29T04:10:00.000Z
  14. SeekingAlpha2026-10-29T02:55:00.000Z
  15. SeekingAlpha2026-10-29T02:43:02.000Z
  16. Yahoo2026-10-29T07:15:20.000Z
  17. Yahoo2026-10-29T07:02:37.000Z
  18. Yahoo2026-10-29T04:51:10.000Z
  19. Yahoo2026-10-29T09:47:50.000Z
  20. Yahoo2026-10-29T09:30:04.000Z
  21. Yahoo2026-10-29T04:33:50.000Z
  22. Yahoo2026-10-29T03:12:02.000Z
  23. Yahoo2026-10-29T09:38:28.000Z
  24. Yahoo2026-10-29T09:04:31.000Z
  25. Yahoo2026-10-29T07:33:00.000Z
ES / MESE-mini / Micro E-mini S&P 500Weekly thesis · STRESSED

The Lines in the Sand

7,775Top of the box; an hourly close above hands bulls control.
7,740Floor defended overnight; an hourly close below flips it bearish.
7,811.75Prior-week high where the push failed to stick.

The Trap

In a tight box, every poke toward 7775 or 7740 feels like the start of the real move, and the crowd that jumps on the first poke gets chopped as price rotates back to the middle. The weekly chart showed the same thing when the run through 7811.75 didn't hold.

Last price7,768.75
ADR · 30 sessions79.96 pts
Daily EMA217,762.7ABOVE
Reopen gapUP · 7 ptsFilled
7,6407,6607,6807,7007,7207,7407,7607,7807,8007,820Thu 9:30close 16:00Fri 9:30close 16:00Mon 9:30close 16:00Tue 9:30close 16:00Wed 9:30close 16:00Prior week high · 7,811.75Prior week low · 7,648.5H1 · EMA21 · ES / MES 7,768.75Dashed: last night's path
Overnight: held

The Read

Bulls took out the 7811.75 prior-week high, tagged 7819.50, and got shoved straight back into the range. The day closed as a near-perfect doji at 7760.75, almost on top of its 7762.70 average, on ordinary volume: nobody won the fight. The strongest tension is the green weekly candle against the failed hold above 7811.75. An hourly close below 7750.50 opens the floor for bears; an hourly close above 7785 hands bulls the door. Between those two, there is no clean edge, and the 08:30 ET GDP data is the likely fuse.

Morning review · Oct 29, 7:30 AM EDT

Neither side owns this one. Bulls have the green weekly candle; bears have the failed push through 7811.75. Overnight, price moved one point net, pinned between 7740 and 7774.50, and the daily candle is a near-doji hugging its 7762.70 average. GDP at 08:30 can break the tie: an hourly close above 7775 hands the bulls the wheel, and a close below 7740 hands it to the bears.

Overnight evidence · 15 cited findings

Overnight price action

  • From the evening baseline, price traded 7740-7774.50 and finished the 06:00 bar at 7768.75.
  • The prior 7760.75 gap level filled during the overnight session.
  • The evening path expected 7768, 7756 and 7764; the observed sequence remained broadly rotational around those values.
  • Price did not cross or close through the 7811.75 weekly invalidation.
  • The overnight measurement uses an H1-boundary approximation.

Overnight events

  • No verified unscheduled event established a directional overnight impulse.
  • GDP remained pending for 08:30 ET at the cutoff (https://www.cmegroup.com/education/events/econoday/667062).
  • The seven-year Treasury auction remained a later rate catalyst (https://www.treasurydirect.gov/auctions/auction-announcements/).
  • Technology headlines added dispersion without resolving index direction.
  • Exact exchange-certified prices and current options positioning were unavailable.

What changed

  • Price action preserves flat direction.
  • The daily near-doji and one-point overnight change support balance.
  • The defense of 7740 and green weekly body add limited upside pressure.
  • Failed acceptance above 7811.75 and mixed breadth oppose a bullish upgrade.
  • Net result: unchanged, with 7740 and 7775 defining the session-resolution boundaries.
Yesterday's daily candle · Wed, Oct 28
Open7,761.5High7,819.5Low7,750.5Close7,760.75
doji · range 69 pts
Projected range · next session53.75 pts7,738.5 – 7,792.25
⚠ Flat / choppy conditions likely

Index drivers

Large caps split at the prior close. Nvidia, Apple, Meta, Tesla, Berkshire and Microsoft slipped, while Micron, AMD, Broadcom, Alphabet and Amazon finished higher, with Micron the standout. No upcoming earnings dates are listed for the group.

Market data as of Oct 29, 7:33 AM EDT · Weights as of 2026-10-01

Evidence · 11 cited findings

Price action · weekly / daily / H1

  • Weekly structure is green from 7689.75 and swept the 7811.75 prior-week high, but the close back below it leaves 7819.50 as failed-auction resistance.
  • The daily candle was an almost exact doji after 0.863 ADR and closed only 1.95 points below the 7762.70 EMA21, showing balance.
  • H1 expanded 69 points from 7819.50 to 7750.50 and closed below its 7765.36 EMA21.
  • Near-term balance is defined by 7750.50 support and 7785 resistance; downside expansion requires an hourly close below support.
  • The projected path is 7768 at 20:00, 7756 at 02:00 and 7764 at 06:00 ET, with a scenario candle of 7760.75/7792.25/7738.50/7756.25.

Metrics

  • The daily range was 69 points versus 79.96 ADR, using 86.3% of normal range.
  • Daily volume was 1.03 times its 30-session average, offering no material volume skew.
  • The H1 expansion threshold is 18.5 points and the latest completed range measured 69 points.
  • A seven-point reopening gap referenced 7760.75 and was already filled; its bucket has a 93.62% same-session fill rate across 94 observations.

Sentiment & current events

  • Post-close headlines reported divergent reactions across Microsoft and Alphabet-related earnings, increasing overnight dispersion (https://finnhub.io/api/news?id=7d0657df8f92023442fe524cbc7163fd485d0a7b262edc5f2a9ebf7af0b7fb75).
  • No authoritative post-FOMC yields, DXY, VIX, policy-probability or options-skew snapshot was verified.
Sources & evidence dates · 31
  1. federalreserve.gov2026-10-28T14:00:00-04:00
  2. bea.gov
  3. bls.gov2026-10-14T08:30:00-04:00
  4. bls.gov2026-10-02T08:30:00-04:00
  5. tradingview.com2026-10-27T00:00:00-04:00
  6. Yahoo2026-10-29T09:34:31.000Z
  7. Yahoo2026-10-29T09:33:00.000Z
  8. Yahoo2026-10-29T09:26:02.000Z
  9. Yahoo2026-10-29T09:29:39.000Z
  10. Yahoo2026-10-29T09:28:10.000Z
  11. Yahoo2026-10-29T09:25:00.000Z
  12. SeekingAlpha2026-10-29T04:10:00.000Z
  13. SeekingAlpha2026-10-29T02:55:00.000Z
  14. SeekingAlpha2026-10-29T02:43:02.000Z
  15. Yahoo2026-10-29T07:15:20.000Z
  16. Yahoo2026-10-29T07:02:37.000Z
  17. Yahoo2026-10-29T04:51:10.000Z
  18. Yahoo2026-10-29T09:47:50.000Z
  19. Yahoo2026-10-29T09:30:04.000Z
  20. Yahoo2026-10-29T04:33:50.000Z
  21. Yahoo2026-10-29T03:12:02.000Z
  22. Yahoo2026-10-29T09:38:28.000Z
  23. Yahoo2026-10-29T09:04:31.000Z
  24. Yahoo2026-10-29T07:33:00.000Z
  25. Yahoo2026-10-29T08:30:02.000Z
  26. Yahoo2026-10-29T08:04:00.000Z
  27. Yahoo2026-10-29T06:35:02.000Z
  28. Yahoo2026-10-29T06:28:34.000Z
  29. Yahoo2026-10-28T22:40:00.000Z
  30. Yahoo2026-10-28T18:45:17.000Z
GC / MGCGold / Micro GoldWeekly thesis · STRESSED

The Lines in the Sand

4,058Hourly reclaim here gives the bounce case room to breathe.
4,026.8Overnight low; lose it hourly and the floor gets thin.
4,097.3Weekly high; acceptance above breaks the lower-high pattern.

The Trap

Dip hunters leaning on the ETF-inflow story keep reaching for gold, but the daily candle just rejected the 4153.04 average with a heavy down body. The bounce off 4026.80 has been weak, and the hourly chart is still printing lower highs.

Last price4,042.7
ADR · 30 sessions75.67 pts
Daily EMA214,153.04BELOW
Reopen gapNo opening gap
3,9804,0004,0204,0404,0604,0804,1004,1204,140Thu 8:20close 13:30Fri 8:20close 13:30Mon 8:20close 13:30Tue 8:20close 13:30Wed 8:20close 13:30Prior week low · 3,989H1 · EMA21 · GC / MGC 4,042.7Dashed: last night's path
Overnight: invalidated

The Read

INVALIDATED

Bears broke gold down to 4037.30, then bulls took it back, closed it at 4081.50 and reclaimed the hourly average at 4061.07. That recovery tilts the night modestly toward bulls, with September ETF inflows as structural fuel in the background. The counter is loud: the daily candle stayed under the 4153.04 average and was rejected there, and volume ran light. An hourly close above 4097.30 opens the door toward the 4120-4140 zone; lose 4060 and the bounce drifts back into balance.

Morning review · Oct 29, 7:30 AM EDT

Bulls have the slow money; bears have the tape. The week is still slightly green and September ETF inflows were large, but daily price rejected the 4153.04 average and overnight slid from 4083 to 4026.80 before a soft bounce to 4042.70. The flip side of the inflow story: September also brought rising yields, a stronger dollar and fund liquidation. Reclaim and hold 4058 and the bounce case gets air; lose 4026.80 on an hourly close and 3991.10 is next on the map.

Overnight evidence · 15 cited findings

Overnight price action

  • From the evening baseline, price traded 4083-4026.80 and finished the 06:00 bar at 4042.70.
  • The evening path expected recovery through 4092 to 4112; price instead moved sharply lower.
  • The projected evening low of 4054.20 failed, invalidating the immediate bullish rebound premise.
  • Price did not cross or close through the 4094.80 weekly thesis invalidation during the measured overnight window.
  • The overnight measurement uses an H1-boundary approximation.

Overnight events

  • No verified unscheduled event was established as the sole cause of the overnight gold decline.
  • GDP remained pending at the cutoff (https://www.cmegroup.com/education/events/econoday/667062).
  • The seven-year Treasury auction remained a later-session yield catalyst (https://www.treasurydirect.gov/auctions/auction-announcements/).
  • ETF-flow evidence is structural rather than a live overnight catalyst (https://www.gold.org/goldhub/research/gold-etfs-holdings-and-flows/2026/10).
  • Exact exchange-certified prices, current DXY and real yields were unavailable.

What changed

  • Price action changes the session direction from bullish to bearish.
  • Failure of 4097.30 and loss of 4060 invalidate the evening recovery premise.
  • The bearish daily body and overnight decline support the new direction.
  • Green weekly structure and ETF demand oppose the read but do not override price action.
  • Net result: INVALIDATED, with downside expansion conditional on an hourly close below 4026.80.
Yesterday's daily candle · Wed, Oct 28
Open4,075.1High4,097.3Low4,037.3Close4,081.5
doji · range 60 pts
Projected range · next session77.6 pts4,054.2 – 4,131.8
Evidence · 12 cited findings

Price action · weekly / daily / H1

  • Weekly structure is green from 4012.10, remains above the 4009.50 prior close and has not swept either prior-week extreme; 4097.30 is the immediate breakout boundary.
  • The daily candle remained below and rejected the 4153.04 EMA21, but buyers recovered the breakdown from 4037.30 and produced a doji close at 4081.50.
  • H1 reclaimed its 4061.07 EMA21 and closed at 4081.50 after the 14:00-16:00 volatility burst.
  • An hourly close above 4097.30 favors continuation toward the already identified 4120-4140 zone; loss of 4060 restores balance.
  • The projected path is 4074 at 20:00, 4092 at 02:00 and 4112 at 06:00 ET, with a scenario candle of 4081.50/4131.80/4054.20/4114.60.

Metrics

  • The daily range was 60 points versus 75.67 ADR, using 79.3% of normal range.
  • Daily volume was 0.837 times its 30-session average, limiting confirmation of the recovery.
  • The close remained 71.54 points, or 0.945 ADR, below the daily EMA21.
  • The H1 expansion threshold is 23.9 points and the latest completed range measured 27.6 points.
  • There is no current-session gap; the distant 4320.70 downside-gap inventory is not applicable to this forecast window.

Sentiment & current events

  • World Gold Council reported September ETF inflows of $10 billion and 67 tonnes, with holdings at 4,256 tonnes; this is structural support rather than proof of overnight direction (https://www.gold.org/goldhub/research/gold-etfs-holdings-and-flows/2026/10).
  • Restrictive policy and possible real-rate pressure oppose structural ETF demand, but no current yield or dollar snapshot was verified.
Sources & evidence dates · 7
  1. federalreserve.gov2026-10-28T14:00:00-04:00
  2. bea.gov
  3. bls.gov2026-10-14T08:30:00-04:00
  4. bls.gov2026-10-02T08:30:00-04:00
  5. gold.org2026-10-07
  6. reddit.com2026-10-26T00:00:00-04:00
CL / MCLWTI Crude Oil / Micro WTI Crude OilWeekly thesis · STRESSED

The Lines in the Sand

102.05Hourly reclaim here takes the teeth out of the pullback.
100.55Overnight low; an hourly close below opens the lower floor.
99.44Weekly low, the last floor before the week cracks.

The Trap

Rebounds have stalled near 102 again and again, and the crowd treating each one as the bull run resuming keeps getting caught. On the flip side, price is still far above its daily average, so late bears pressing lower are leaning against a strong daily chart.

Last price101.22
ADR · 30 sessions3.67 pts
Daily EMA2196.05ABOVE
Reopen gapNo opening gap
9899100101102103104Thu 9:00close 14:30Fri 9:00close 14:30Mon 9:00close 14:30Tue 9:00close 14:30Wed 9:00close 14:30Prior week high · 103.93H1 · EMA21 · CL / MCL 101.22Dashed: last night's path
Overnight: invalidated

The Read

INVALIDATED

Bulls drove crude from 99.74 to 103.55 on heavy volume and closed at 101.94, well above the 96.05 daily average. A reported crude inventory draw adds fuel on the bull side. The tell against it is the rejection from 103.55 and a two-hour pullback, with exhaustion risk after a full-range day. If the 100.93-101.50 zone holds and an hourly close lands above 102.40, the door opens; an hourly close below 100.93 and the rebound case is gone.

Morning review · Oct 29, 7:30 AM EDT

Bulls own the big picture, bears own the last few hours. Price is still far above the 96.05 daily average after a high-volume run, but it rejected 102.33 overnight, dipped to 100.55 and sits at 101.22, with the hourly chart printing lower highs off 103.55. Inventory and Iran-diplomacy headlines cut both ways and weren't fully verified, so GDP at 08:30 is the cleaner catalyst. Reclaim and hold 102.05 and the pullback loses its grip; an hourly close below 100.55 brings 99.44 into view.

Overnight evidence · 15 cited findings

Overnight price action

  • From the evening baseline, price traded 100.55-102.33 and finished the 06:00 bar at 101.22.
  • The evening path expected recovery through 102.18 to 102.78; price instead declined.
  • The evening 100.93 invalidation level was breached, invalidating the immediate bullish rebound premise.
  • Price did not cross or close through the 99.35 weekly thesis invalidation.
  • The overnight measurement uses an H1-boundary approximation.

Overnight events

  • No verified unscheduled event was established as the sole cause of the crude decline.
  • GDP remained pending at the cutoff (https://www.cmegroup.com/education/events/econoday/667062).
  • Detailed EIA inventory figures were not independently recovered from readable primary content (https://www.eia.gov/petroleum/supply/weekly/pdf/highlights.pdf).
  • Diplomacy and supply-disruption reports remained below full verification (https://www.reuters.com/business/energy/us-oil-prices-fall-investors-gauge-risks-mideast-supply-2026-10-29).
  • Exact exchange-certified prices and physical-market flow data were unavailable.

What changed

  • Price action changes the session direction from bullish to bearish.
  • Failure of 102.40 and loss of 100.93 invalidate the evening rebound premise.
  • Bearish daily and H1 structure support the new direction.
  • Distance above the daily EMA21 and possible inventory draws oppose the read.
  • Net result: INVALIDATED, with downside expansion conditional on an hourly close below 100.55.
Yesterday's daily candle · Wed, Oct 28
Open100.2High103.55Low99.74Close101.94
bullish · range 3.81 pts
Projected range · next session3.33 pts100.72 – 104.05
Evidence · 13 cited findings

Price action · weekly / daily / H1

  • Weekly price remains inside the prior-week range and below the 103.43 prior close, leaving the broader weekly candle flat despite holding above 99.44.
  • The daily candle was bullish, used 1.04 ADR and closed at 101.94, 5.89 points above the 96.05 EMA21, on 2.966 times average volume.
  • H1 pulled back for two hours from 103.55 and closed near its 101.90 EMA21.
  • Holding 100.93-101.50 supports a rebound, while an hourly close above 102.40 is the cleaner continuation trigger.
  • The projected path is 101.65 at 20:00, 102.18 at 02:00 and 102.78 at 06:00 ET, with a scenario candle of 101.94/104.05/100.72/103.18.

Metrics

  • The daily range was 3.81 points versus 3.67 ADR, using 104% of normal range.
  • Daily volume was 2.966 times its 30-session average, strongly confirming participation but also raising exhaustion risk.
  • The daily close was 1.606 ADR above its EMA21.
  • The H1 expansion threshold is 0.82 and the latest completed range measured 1.16.
  • There is no current-session gap; old open gaps at 79.94 and 85.16 are not applicable to this window.

Sentiment & current events

  • Current reporting on the October 28 EIA release identified a 1.9-million-barrel commercial crude draw to about 410.6 million barrels (https://www.ogj.com/general-interest/economics-markets/news/55415055/eia-us-crude-oil-inventories-down-19-million-bbl).
  • The older EIA report for the week ended October 16 is superseded and excluded from current direction (https://www.eia.gov/petroleum/supply/weekly/archive/2026/2026_10_21/download/summary.txt).
  • The complete October 28 primary EIA tables were not extracted, leaving product stocks, imports, exports, refinery utilization and demand details incomplete.
Sources & evidence dates · 9
  1. federalreserve.gov2026-10-28T14:00:00-04:00
  2. bea.gov
  3. bls.gov2026-10-14T08:30:00-04:00
  4. bls.gov2026-10-02T08:30:00-04:00
  5. eia.gov2026-10-21
  6. Current reporting on the October 28 EIA release identifies a 1.9-million-barrel commercial crude draw to approximately 410.6 million barrels. This supersedes the older October 16 balance, although the complete primary EIA table was not independently extracted during this check.2026-10-28
  7. forexfactory.com2026-10-27
  8. reddit.com2026-10-26T00:00:00-04:00

Free. Always. Futures trading edge in your inbox.

You're in. Watch your inbox.

We do not send junk mail. We do not spam.