Session Prep

Two minutes tonight. A plan tomorrow.
Morning review · Data as of Wed, Oct 28, 7:00 AM EDT · All times Eastern
Deep research

This morning's one thing

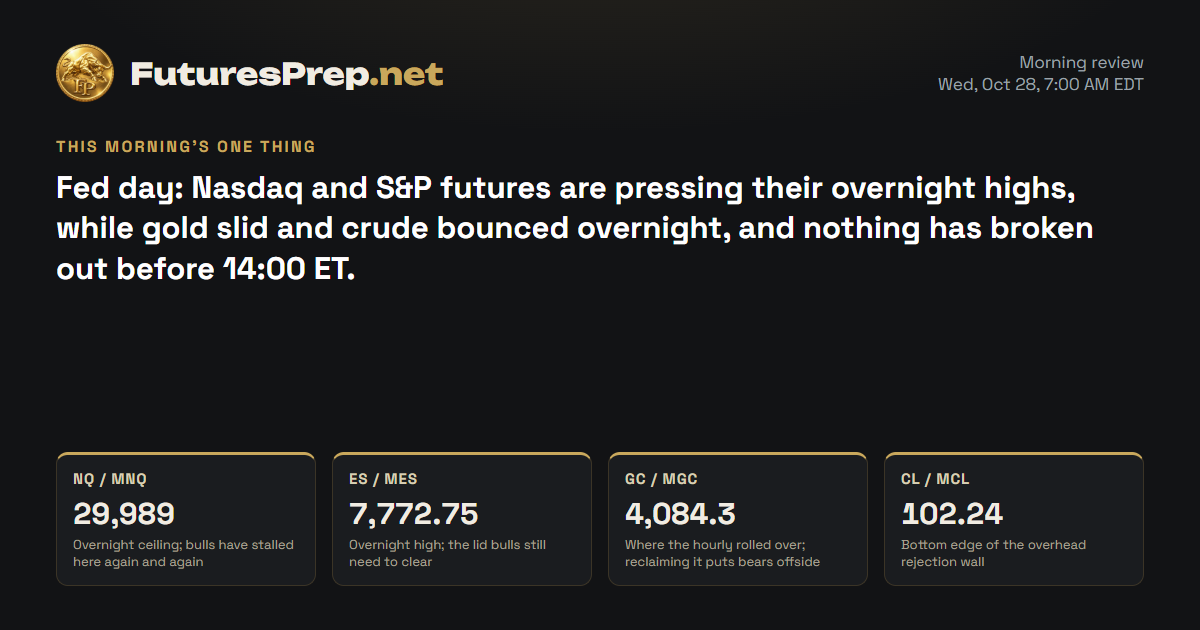
Fed day: Nasdaq and S&P futures are pressing their overnight highs, while gold slid and crude bounced overnight, and nothing has broken out before 14:00 ET.

Today's market movers · Wednesday, October 28

Time ETImpactEventForecastPrevious
2:00 PMHighFederal Funds Rate4.00%4.00%
2:00 PMHighFOMC Statement——
2:30 PMHighFOMC Press Conference——

U.S. releases, high and medium impact.

NQ / MNQE-mini / Micro E-mini Nasdaq-100Weekly thesis · STRESSED

The Lines in the Sand

29,989Overnight ceiling; bulls have stalled here again and again
30,114Last week's high, the bigger roof still untouched
29,760Hourly floor; losing it breaks the bullish staircase

The Trap

Repeated stalls at 29989 tend to pull in late chasers just before a pullback. On Fed afternoons a clean morning trend often snaps the other way.

Last price29,948.5
ADR · 30 sessions524.77 pts
Daily EMA2130,058.43BELOW
Reopen gapUP · 11.75 ptsFilled
29,00029,20029,40029,60029,80030,00030,200Wed 9:30close 16:00Thu 9:30close 16:00Fri 9:30close 16:00Mon 9:30close 16:00Tue 9:30close 16:00Prior week high · 30,114Prior week low · 28,986.25H1 · EMA21 · NQ / MNQ 29,948.5Dashed: last night's path
Overnight: held

The Read

Bulls dragged the Nasdaq off the 29288.75 low and closed it at 29804, near the top of the day. Bears still hold the high ground: price stalled under the 30058.43 daily average, and the day already used more than its normal range, so the fuel is thinner than it looks. The hourly chart is coiling just under 29881.5 with a rising average beneath it, which favors bulls for now. The biggest counterweight is the Fed decision Wednesday at 2:00 p.m. ET, which can wipe out any overnight drift. If price holds above 29881.5, the door opens toward 30114; an hourly close below 29760 and the floor is gone.

Morning review · Oct 28, 7:30 AM EDT

Bulls lifted MNQ from 29815.75 to 29948.5 overnight, then hit a wall at 29989 more than once. The hourly chart still stacks higher highs and higher lows, so the bulls hold the edge for now. Bears still have a case: price sits under the 30058.43 daily average and short of last week's 30114 high, with the Fed at 14:00 ET and Microsoft and Alphabet earnings after the close. If an hourly candle closes above 29989, the path toward 30114 opens; lose 29760 and the bullish structure is gone.

Overnight evidence · 12 cited findings

Overnight price action

  • MNQ rose 132.75 points from the prior-evening baseline and traded between 29783.5 and 29989.
  • The overnight range was 205.5 points, or 0.392 ADR, and did not cross the 30114 weekly-thesis invalidation.
  • The prior path expected 29935 by 06:00 ET; the completed 06:00 bar closed at 29948.5.
  • The 29804 opening-gap level filled during the overnight session.

Overnight events

  • No supplied evidence established a completed high-impact scheduled U.S. release before the 07:30 ET cutoff.
  • The 08:30 ET Advance Economic Indicators release remained ahead at the cutoff: https://www.census.gov/foreign-trade/schedule.html
  • FOMC and megacap earnings remained future events rather than explanations for the observed overnight move: https://www.federalreserve.gov/newsevents/2026-october.htm
  • Geopolitical diplomacy reporting was contested and receives no directional weight: https://www.rferl.org/a/iran-live-blog-trump-middle-east/33803414.html?lbis=474559

What changed

  • Price action preserves the prior bullish direction.
  • Overnight continuation, the filled gap and position above the rising H1 EMA21 support an unchanged verdict.
  • Sub-threshold H1 range and resistance at 29989, 30058.43 and 30114 limit confidence.
  • FOMC and megacap earnings concentration add substantial event risk without changing direction.
Yesterday's daily candle · Tue, Oct 27
Open29,481High29,881.5Low29,288.75Close29,804
bullish · range 592.75 pts
Projected range · next session310 pts29,705 – 30,015

Index drivers

Most Nasdaq heavyweights closed higher on Tuesday. Broadcom and Tesla led, with Amazon, Alphabet, Apple and Nvidia also up. Microsoft and Meta finished lower, and Microsoft and Alphabet are scheduled to report earnings after Wednesday's close.

Market data as of Oct 28, 7:33 AM EDT · Weights as of 2026-09-30

Evidence · 10 cited findings

Price action · weekly / daily / H1

  • Weekly price advanced from 29024 to 29804, held above the 28986.25 prior-week low and formed a strong green body, although 30114 remains unresolved resistance.
  • The daily session recovered from 29288.75 to close at 29804 near the upper quartile; rejection below the 30058.43 daily EMA21 prevents full trend confirmation.
  • H1 price remains above the rising 29619.48 EMA21 after an impulsive rally, and compression beneath 29881.5 supports continuation if that high is accepted; a close below 29760 would weaken the bullish structure.

Metrics

  • The completed daily range was 592.75 points, or 1.13 times the 524.77-point ADR30, so substantial movement has already occurred and continuation may be less efficient.
  • The final H1 range was 62.25 points versus a 105-point expansion threshold, with no active expansion and five bars elapsed since the last one.
  • The daily close remained 0.485 ADR below the EMA21, while the bullish body measured 0.616 ADR on 0.97 times 30-day average volume.
  • Index-driver breadth was mostly constructive: NVDA +0.90%, AAPL +0.93%, AMZN +1.61%, AVGO +4.00%, GOOGL +1.19% and TSLA +4.04%, while MSFT fell 0.24% and META fell 1.64%; weights and quotes: https://www.invesco.com/qqq-etf/en/about.html

Sentiment & current events

  • Equity indexes reportedly advanced as technology strength and easing oil supported risk appetite ahead of the Fed decision, consistent with bullish price action: https://www.kitco.com/news/off-the-wire/2026-10-27/sp-500-nasdaq-advance-oil-eases-ahead-fed-decision
  • The strongest contradiction is event risk: the FOMC decision is scheduled for Wednesday at 2:00 p.m. ET and the press conference at 2:30 p.m., after this forecast horizon: https://www.federalreserve.gov/newsevents/2026-october.htm?view=calendar
  • The fresh forum sample was too thin and selectively indexed to establish representative positioning: https://www.tradingview.com/symbols/CME_MINI-NQ1!/minds
Sources & evidence dates · 31
  1. The FOMC decision is scheduled for 2026-10-28 at 2:00 p.m. ET, followed by the Chair's press conference at 2:30 p.m. ET. The target range is 3.75%-4.00%, and contemporaneous futures-based sources indicated roughly a 90%-93% probability of no change.2026-10-07
  2. forex.tradingcharts.com2026-10-27
  3. ecb.europa.eu2026-10-26
  4. A $44 billion 7-year Treasury note auction is identified for 2026-10-29, with the auction normally occurring at 1:00 p.m. ET; weak demand would present an upside-yield risk.2026-10-22
  5. stocktitan.net2026-10-23
  6. wdez.com2026-10-27T09:23:00-04:00
  7. Reports describe continuing attacks and shipping disruption around Hormuz, while diplomatic developments have moderated crude prices; direct operational-flow and damage evidence remained incomplete.2026-10-27
  8. Houthis claimed attacks on Saudi East-West pipeline pumping stations and Riyadh airport, but Saudi confirmation and an authoritative damage assessment were unavailable.2026-10-26
  9. The 2026 UK Budget statement is scheduled for 2026-10-28 at approximately 12:30 p.m. London time, immediately after Prime Minister's Questions.2026-10-23
  10. reuters.com2026-10-26
  11. TradingView discussion was characterized as cautiously bullish for MES and MNQ, but dynamically rendered posts and selective indexing do not provide a reproducible or representative sentiment sample.2026-10-27
  12. kitco.com2026-10-27T14:52:00-04:00
  13. tradingview.com2026-10-27
  14. Yahoo2026-10-28T09:37:13.000Z
  15. Yahoo2026-10-28T09:35:00.000Z
  16. Yahoo2026-10-28T09:26:01.000Z
  17. Yahoo2026-10-28T09:48:36.000Z
  18. Yahoo2026-10-28T09:17:55.000Z
  19. Yahoo2026-10-28T09:01:54.000Z
  20. Yahoo2026-10-28T09:53:28.000Z
  21. Yahoo2026-10-28T07:36:12.000Z
  22. Yahoo2026-10-28T07:05:02.000Z
  23. SeekingAlpha2026-10-28T07:08:00.000Z
  24. Yahoo2026-10-28T07:00:00.000Z
  25. Yahoo2026-10-28T06:22:34.000Z
  26. Yahoo2026-10-28T08:30:00.000Z
  27. Yahoo2026-10-28T07:46:00.000Z
  28. Yahoo2026-10-28T08:22:55.000Z
  29. Yahoo2026-10-28T08:06:42.000Z
  30. ChartMill2026-10-28T07:16:04.000Z
  31. Yahoo2026-10-28T06:05:31.000Z
ES / MESE-mini / Micro E-mini S&P 500Weekly thesis · STRESSED

The Lines in the Sand

7,772.75Overnight high; the lid bulls still need to clear
7,811.75Last week's high caps the bigger picture
7,745Hourly floor; below it the bullish structure cracks

The Trap

The tight coil under 7772.75 tends to draw early breakout chasers who get flushed when the high fails. With thin volume there is little cushion when a breakout fails.

Last price7,768.25
ADR · 30 sessions81.78 pts
Daily EMA217,762.94ABOVE
Reopen gapUP · 5.25 ptsFilled
7,6407,6607,6807,7007,7207,7407,7607,7807,8007,820Wed 9:30close 16:00Thu 9:30close 16:00Fri 9:30close 16:00Mon 9:30close 16:00Tue 9:30close 16:00Prior week high · 7,811.75Prior week low · 7,648.5H1 · EMA21 · ES / MES 7,768.25Dashed: last night's path
Overnight: held

The Read

Bears had the S&P down at 7699.75, then bulls took the day back and closed at 7756.25 near the top of the range. The fight is now right overhead: the 7762.94 daily average and the 7772.5 session high both rejected the push. The hourly trend underneath is rising, and the day left more range unused than the Nasdaq did. The counterweight is the Fed: Wednesday's 2:00 p.m. ET decision and press conference can flip a pre-event trend in minutes. If 7772.5 gets accepted, the door opens to 7800-7811.75; an hourly close below 7745 and the bounce turns into rotation.

Morning review · Oct 28, 7:30 AM EDT

Bulls took back the 7762.94 daily average overnight after it rejected price on Tuesday, then pushed to 7772.75 and ran out of steam. The range is narrow and volume thin, so the bulls are not showing much conviction. Last week's 7811.75 high still caps the bigger picture, and the Fed at 14:00 ET can flip the whole tape. If an hourly candle closes above 7772.75, the path toward 7811.75 opens; lose 7745 and the floor is gone.

Overnight evidence · 12 cited findings

Overnight price action

  • MES gained 6.75 points from the prior-evening baseline and traded between 7752.5 and 7772.75.
  • The overnight range was 20.25 points, or 0.248 ADR, and did not cross the 7811.75 weekly-thesis invalidation.
  • The prior path expected 7780.25 by 06:00 ET; the completed 06:00 bar closed at 7768.25.
  • The 7756.25 opening-gap level filled during the overnight session.

Overnight events

  • No supplied evidence established a completed high-impact scheduled U.S. release before the 07:30 ET cutoff.
  • The 08:30 ET Advance Economic Indicators release remained ahead: https://www.census.gov/foreign-trade/schedule.html
  • FOMC and megacap earnings remained future catalysts rather than explanations for the overnight move: https://www.federalreserve.gov/newsevents/2026-october.htm
  • Contested geopolitical reporting receives no directional weight: https://www.rferl.org/a/iran-live-blog-trump-middle-east/33803414.html?lbis=474559

What changed

  • Price action preserves the prior bullish direction.
  • The filled gap, daily EMA21 reclaim and H1 position support an unchanged verdict.
  • Compression beneath 7772.75 and low body participation limit confidence.
  • FOMC and megacap earnings exposure add event risk without overriding price direction.
Yesterday's daily candle · Tue, Oct 27
Open7,715.5High7,772.5Low7,699.75Close7,756.25
bullish · range 72.75 pts
Projected range · next session53.75 pts7,738.5 – 7,792.25

Index drivers

S&P heavyweights were broadly higher on Tuesday but uneven. AMD, Tesla, Broadcom, Micron and Amazon led the gains, while Microsoft, Meta and Berkshire Hathaway closed lower. Microsoft and Alphabet are scheduled to report earnings after Wednesday's close.

Market data as of Oct 28, 7:33 AM EDT · Weights as of 2026-10-01

Evidence · 11 cited findings

Price action · weekly / daily / H1

  • Weekly price is green from 7689.75 and recovered to 7756.25 without losing the 7648.5 prior-week low, but remains below the 7811.75 prior-week high.
  • The daily candle closed bullish near its upper range after testing 7699.75, while rejection at the 7762.94 daily EMA21 and the 7772.5 session high creates immediate resistance.
  • H1 price holds above the rising 7737.06 EMA21 after a broad recovery; acceptance above 7772.5 would reopen 7800-7811.75, while loss of 7745 would imply rotation.

Metrics

  • The daily range was 72.75 points, or 0.89 times the 81.78-point ADR30, leaving more range capacity than MNQ.
  • The final H1 range was 9.5 points against an 18.5-point expansion threshold, with four bars elapsed since the last expansion.
  • The close was only 0.082 ADR below the daily EMA21; the bullish body measured 0.498 ADR on 0.962 times average volume.
  • Major SPY drivers were broadly positive—NVDA +0.90%, AAPL +0.93%, AMZN +1.61%, AVGO +4.00%, GOOGL +1.19%, MU +2.77% and AMD +5.45%—while MSFT, META and Berkshire declined; weights and quotes: https://www.ssga.com/us/en/intermediary/etfs/state-street-spdr-sp-500-etf-trust-spy

Sentiment & current events

  • Verified reporting described technology-led equity gains ahead of the Fed, supporting the observed bullish structure: https://www.kitco.com/news/off-the-wire/2026-10-27/sp-500-nasdaq-advance-oil-eases-ahead-fed-decision
  • The strongest contradiction is event concentration: Wednesday's 2:00 p.m. FOMC decision and 2:30 p.m. press conference can reverse the pre-event trend but occur after this forecast horizon: https://www.federalreserve.gov/newsevents/2026-october.htm?view=calendar
  • Reported megacap earnings timing was not corroborated through all primary investor-relations sources and therefore does not receive directional weight.
  • The available social sample was too selective to establish representative positioning: https://www.tradingview.com/symbols/CME_MINI-ES1!/minds/
Sources & evidence dates · 39
  1. The FOMC decision is scheduled for 2026-10-28 at 2:00 p.m. ET, followed by the Chair's press conference at 2:30 p.m. ET. The target range is 3.75%-4.00%, and contemporaneous futures-based sources indicated roughly a 90%-93% probability of no change.2026-10-07
  2. forex.tradingcharts.com2026-10-27
  3. ecb.europa.eu2026-10-26
  4. A $44 billion 7-year Treasury note auction is identified for 2026-10-29, with the auction normally occurring at 1:00 p.m. ET; weak demand would present an upside-yield risk.2026-10-22
  5. stocktitan.net2026-10-23
  6. wdez.com2026-10-27T09:23:00-04:00
  7. Reports describe continuing attacks and shipping disruption around Hormuz, while diplomatic developments have moderated crude prices; direct operational-flow and damage evidence remained incomplete.2026-10-27
  8. Houthis claimed attacks on Saudi East-West pipeline pumping stations and Riyadh airport, but Saudi confirmation and an authoritative damage assessment were unavailable.2026-10-26
  9. The 2026 UK Budget statement is scheduled for 2026-10-28 at approximately 12:30 p.m. London time, immediately after Prime Minister's Questions.2026-10-23
  10. reuters.com2026-10-26
  11. TradingView discussion was characterized as cautiously bullish for MES and MNQ, but dynamically rendered posts and selective indexing do not provide a reproducible or representative sentiment sample.2026-10-27
  12. kitco.com2026-10-27T14:52:00-04:00
  13. tradingview.com2026-10-27
  14. Yahoo2026-10-28T09:37:13.000Z
  15. Yahoo2026-10-28T09:35:00.000Z
  16. Yahoo2026-10-28T09:26:01.000Z
  17. Yahoo2026-10-28T09:48:36.000Z
  18. Yahoo2026-10-28T09:17:55.000Z
  19. Yahoo2026-10-28T09:01:54.000Z
  20. Yahoo2026-10-28T09:53:28.000Z
  21. Yahoo2026-10-28T07:36:12.000Z
  22. Yahoo2026-10-28T07:05:02.000Z
  23. SeekingAlpha2026-10-28T07:08:00.000Z
  24. Yahoo2026-10-28T07:00:00.000Z
  25. Yahoo2026-10-28T06:22:34.000Z
  26. Yahoo2026-10-28T08:30:00.000Z
  27. Yahoo2026-10-28T07:46:00.000Z
  28. Yahoo2026-10-28T08:22:55.000Z
  29. Yahoo2026-10-28T08:06:42.000Z
  30. ChartMill2026-10-28T07:16:04.000Z
  31. Yahoo2026-10-28T06:05:31.000Z
  32. ChartMill2026-10-28T09:11:06.000Z
  33. Yahoo2026-10-28T08:22:49.000Z
  34. Yahoo2026-10-28T05:12:01.000Z
  35. Yahoo2026-10-28T04:20:00.000Z
  36. Yahoo2026-10-28T00:39:58.000Z
  37. Yahoo2026-10-27T20:35:00.000Z
  38. Yahoo2026-10-27T19:07:22.000Z
  39. Yahoo2026-10-27T18:35:00.000Z
GC / MGCGold / Micro GoldWeekly thesis · STRESSED

The Lines in the Sand

4,084.3Where the hourly rolled over; reclaiming it puts bears offside
4,040Overnight low; the gate to further downside
4,012.1Weekly open; the bulls' last card for a green week

The Trap

After a sharp overnight drop, late bears tend to pile in near 4040 just as the green weekly candle tries to defend. The Fed afternoon can then whipsaw both sides.

Last price4,058.5
ADR · 30 sessions78.37 pts
Daily EMA214,159.57BELOW
Reopen gapUP · 2.2 ptsFilled
3,9804,0004,0204,0404,0604,0804,1004,1204,1404,1604,180Wed 8:20close 13:30Thu 8:20close 13:30Fri 8:20close 13:30Mon 8:20close 13:30Tue 8:20close 13:30Prior week low · 3,989H1 · EMA21 · GC / MGC 4,058.5Dashed: last night's path
Overnight: invalidated

The Read

INVALIDATED

Bears pressed gold to 3991.1 this week, then bulls pulled it back to 4072.9 with a nearly full-range day off 4001.6. The bounce came on below-average volume, and price still sits far below the 4159.57 daily average, so this is a recovery inside a bigger downtrend, not a trend change. ETF inflows offer slow-moving support, but the strongest counter-argument is a firm dollar and elevated yields ahead of Wednesday's Fed decision. The hourly chart is coiling tight under 4079.5, which tilts things only slightly toward bulls. Hold 4060 and clear 4079.5, and 4094.8 is close; an hourly close below 4060 and the floor slides to 4047.9.

Morning review · Oct 28, 7:30 AM EDT

Bears won the overnight round: gold rolled over at 4084.3, slid to 4040 and sits at 4058.5, and the hourly lost its run of higher closes. Bulls still have the week, which stays green above the 4012.1 open, though price trades far below the 4159.57 daily average. Neither side has a strong grip, and the Fed at 14:00 ET can swing gold hard either way. If an hourly candle closes back above 4084.3, the bears are offside; if one closes below 4040, the slide toward 4012.1 opens.

Overnight evidence · 12 cited findings

Overnight price action

  • MGC declined 16.6 points from the prior-evening baseline and traded between 4040 and 4084.3.
  • The overnight range was 44.3 points, or 0.565 ADR, and did not cross the 4094.8 weekly-thesis invalidation.
  • The prior path expected 4094.5 by 06:00 ET; the completed 06:00 bar instead closed at 4058.5.
  • The 4072.9 opening-gap level filled overnight.

Overnight events

  • No supplied evidence established a completed high-impact scheduled U.S. release before the 07:30 ET cutoff.
  • The 08:30 ET Advance Economic Indicators release remained ahead: https://www.census.gov/foreign-trade/schedule.html
  • FOMC remained a future catalyst rather than an explanation for the overnight decline: https://www.federalreserve.gov/newsevents/2026-october.htm
  • Contested geopolitical reports could not substantiate a haven-demand narrative: https://www.rferl.org/a/iran-live-blog-trump-middle-east/33803414.html?lbis=474559

What changed

  • Morning price action opposes and invalidates the prior bullish session read.
  • The bearish daily candle, rollover from 4084.3 and loss of higher H1 closes support the invalidation.
  • The green weekly candle and structural ETF-flow evidence are the principal contradictions.
  • A close below 4040 is still required to confirm downside expansion, while FOMC risk limits conviction.
Yesterday's daily candle · Tue, Oct 27
Open4,032High4,079.5Low4,001.6Close4,072.9
bullish · range 77.9 pts
Projected range · next session55.4 pts4,053.2 – 4,108.6
Evidence · 11 cited findings

Price action · weekly / daily / H1

  • Weekly price rebounded from 3991.1 to 4072.9 and is green above the 4009.5 prior-week close, although it remains well below the 4211.2 prior-week high.
  • The daily candle recovered nearly the full 78.37-point ADR from 4001.6 and closed near its high, but the larger trend remains constrained beneath the 4159.57 daily EMA21.
  • H1 price is above its rising 4047.90 EMA21 after a sharp 10:00-11:00 advance, and late compression beneath 4079.5 favors another test while 4060 holds.

Metrics

  • The daily range was 77.9 points, or 0.994 times the 78.37-point ADR30, indicating most of a normal daily range was already consumed.
  • The final H1 range compressed to 3.5 points versus a 23.9-point expansion threshold, with six bars elapsed since the last expansion.
  • The close remained 1.106 ADR below the daily EMA21; the bullish body measured 0.522 ADR on only 0.795 times average volume.
  • World Gold Council data showed approximately $10 billion of September ETF inflows and Q3 inflows near $31 billion, with holdings rising 67 tonnes to 4,256 tonnes: https://www.gold.org/goldhub/research/gold-etfs-holdings-and-flows/2026/10

Sentiment & current events

  • The strongest contradiction is the reported combination of elevated nominal and real Treasury yields and dollar strength, which is a macro headwind against bullish price action; exact supplied yield observations were not independently extracted: https://home.treasury.gov/resource-center/data-chart-center/interest-rates/pages/xml?data=daily_treasury_real_yield_curve&field_tdr_date_value_month=202610
  • Gold commentary was divided between dollar-and-yield pressure and psychological or haven support; exact spot and futures levels are not directly comparable: https://www.fxstreet.com/news/gold-struggles-near-4-000-as-us-dollar-strengthens-ahead-of-fed-decision-202610271107
  • The FOMC decision is scheduled for 2:00 p.m. ET Wednesday with a 2:30 p.m. press conference, after the overnight forecast: https://www.federalreserve.gov/newsevents/2026-october.htm?view=calendar
  • The current social sample was too thin to establish reliable gold positioning: https://www.tradingview.com/symbols/CME_MINI-NQ1!/minds
Sources & evidence dates · 15
  1. The FOMC decision is scheduled for 2026-10-28 at 2:00 p.m. ET, followed by the Chair's press conference at 2:30 p.m. ET. The target range is 3.75%-4.00%, and contemporaneous futures-based sources indicated roughly a 90%-93% probability of no change.2026-10-07
  2. forex.tradingcharts.com2026-10-27
  3. ecb.europa.eu2026-10-26
  4. A $44 billion 7-year Treasury note auction is identified for 2026-10-29, with the auction normally occurring at 1:00 p.m. ET; weak demand would present an upside-yield risk.2026-10-22
  5. wdez.com2026-10-27T09:23:00-04:00
  6. home.treasury.gov2026-10-26T00:00:00-04:00
  7. World Gold Council reporting states that global physically backed gold ETFs attracted approximately $10 billion in September, Q3 inflows reached approximately $31 billion, and holdings increased 67 tonnes to 4,256 tonnes.2026-10-07T00:00:00-04:00
  8. India's domestic gold discount reportedly narrowed from a September average of $66/oz to $8/oz on 2026-10-16, while high prices continued to constrain jewellery demand.2026-10-20T00:00:00-04:00
  9. Reports describe continuing attacks and shipping disruption around Hormuz, while diplomatic developments have moderated crude prices; direct operational-flow and damage evidence remained incomplete.2026-10-27
  10. Houthis claimed attacks on Saudi East-West pipeline pumping stations and Riyadh airport, but Saudi confirmation and an authoritative damage assessment were unavailable.2026-10-26
  11. The U.S. Treasury announced sanctions on 2026-10-21 targeting Iranian shadow-fleet vessels, shipping agents, facilitators and associated financial relationships.2026-10-21
  12. The 2026 UK Budget statement is scheduled for 2026-10-28 at approximately 12:30 p.m. London time, immediately after Prime Minister's Questions.2026-10-23
  13. reuters.com2026-10-26
  14. Gold commentary was divided around $4,000, with dollar strength and elevated yields cited as bearish forces and psychological support or haven demand cited as bullish forces; exact spot-versus-futures levels are not directly comparable.2026-10-27T11:07:00Z
  15. tradingview.com2026-10-27
CL / MCLWTI Crude Oil / Micro WTI Crude OilWeekly thesis · STRESSED

The Lines in the Sand

102.24Bottom edge of the overhead rejection wall
103.13Weekly high; the top of the wall
99.74Overnight low; losing it erases the rebound

The Trap

Rebounds into a known rejection zone tend to pull in late bulls just under 102.24, where price has been turned away before. EIA data at 10:30 ET can whip around anyone who chased the bounce.

Last price101.53
ADR · 30 sessions3.68 pts
Daily EMA2195.48ABOVE
Reopen gapNo opening gap
96979899100101102103104Wed 9:00close 14:30Thu 9:00close 14:30Fri 9:00close 14:30Mon 9:00close 14:30Tue 9:00close 14:30Prior week high · 103.93H1 · EMA21 · CL / MCL 101.53Dashed: last night's path
Overnight: invalidated

The Read

INVALIDATED

Bulls tried to push crude back up and got rejected at 102.81, and bears drove it to a 100.23 close on volume about three times the normal size. That is a loud tell, and price now sits under a falling hourly average at 100.77 after repeated failures between 101.5 and 102.8. Diplomacy hopes outweighed supportive stock data into the close. The strongest counter-argument is supply risk: attacks, sanctions and Hormuz disruption can put the fear premium back without warning, and EIA inventory data lands Wednesday at 10:30 a.m. ET. An hourly close below 99.44 opens the floor; recover 101 and the bearish lean is neutralized, with 102.81 the line that would put bulls back in charge.

Morning review · Oct 28, 7:30 AM EDT

Crude bulls came back overnight, lifting MCL from 99.74 to 101.53 and back above the hourly average. Bears still have the bigger picture: the week remains red under the 102.55 open, and a dense rejection wall sits from 102.24 to 103.13. EIA inventories at 10:30 ET and disputed Iran headlines could move price sharply either way. If an hourly candle closes above 102.24, the bears are offside; lose 99.74 and the rebound is erased.

Overnight evidence · 12 cited findings

Overnight price action

  • MCL gained 1.33 points from the prior-evening baseline and traded between 99.74 and 102.24.
  • The overnight range was 2.5 points, or 0.679 ADR, and did not cross or close through the 99.35 weekly-thesis invalidation.
  • The prior path expected 99.35 by 06:00 ET; the completed 06:00 bar instead closed at 101.53.
  • No current-session opening gap required a fill.

Overnight events

  • No scheduled EIA release occurred before the 07:30 ET cutoff; the report remained due at 10:30 ET: https://www.eia.gov/petroleum/data.php
  • The FOMC remained a future catalyst rather than an explanation for the overnight recovery: https://www.federalreserve.gov/newsevents/2026-october.htm
  • Iran-Qatar diplomatic reporting was contested and could not substantiate a de-escalation narrative: https://www.rferl.org/a/iran-live-blog-trump-middle-east/33803414.html?lbis=474559
  • No verified overnight operational-flow or refinery-outage evidence was available.

What changed

  • Morning price action opposes and invalidates the prior bearish session read.
  • The rebound from 99.74, bullish daily candle and reclaim of the rising H1 EMA21 support invalidation.
  • The red weekly candle and 102.24-103.13 resistance are the principal contradictions.
  • EIA and geopolitical headline risk limit confidence until 102.24 is accepted.
Yesterday's daily candle · Tue, Oct 27
Open101.32High102.81Low99.44Close100.23
bearish · range 3.37 pts
Projected range · next session2.07 pts98.85 – 100.92
Evidence · 10 cited findings

Price action · weekly / daily / H1

  • Weekly price is red from 102.55 and retreated to 100.23 after failing below the 103.93 prior-week high, establishing lower highs while remaining above the 95.26 prior-week low.
  • The daily candle rejected 102.81 and closed bearish on 3.064 times average volume; price remains 1.292 ADR above the 95.48 daily EMA21, leaving room for mean reversion.
  • H1 price sits below its falling 100.77 EMA21 after repeated failures from 101.5 to 102.8; a close below 99.44 would confirm renewed downside, while recovery above 101 would neutralize it.

Metrics

  • The daily range was 3.37 points, or 0.916 times the 3.68-point ADR30, leaving limited but nonzero normal-range capacity.
  • The final H1 range was 0.62 against a 0.82-point expansion threshold, and only one bar had elapsed since the last expansion.
  • The bearish daily body measured 0.296 ADR on exceptionally high volume at 3.064 times the 30-day average.
  • The 103.43 downside-gap level from October 26 remains open above price; the much older 79.94 and 85.16 upside-gap levels are remote and not relevant to the overnight forecast.

Sentiment & current events

  • The strongest contradiction is supply-risk reversal potential: attacks, sanctions and Hormuz disruption could abruptly restore geopolitical premium despite the bearish chart: https://www.reuters.com/business/energy/oil-eases-middle-east-diplomacy-hopes-saudi-attacks-keep-supply-worries-alive-2026-10-27
  • EIA's Weekly Petroleum Status Report is scheduled for Wednesday at 10:30 a.m. ET, and no reliable public inventory consensus was verified: https://www.eia.gov/reports/upcoming.php
  • The prior verified EIA report showed commercial crude inventories down approximately 3.1 million barrels to 412.5 million, but it will be superseded by Wednesday's release: https://www.eia.gov/petroleum/supply/weekly/archive/2026/2026_10_21/pdf/highlights.pdf
Sources & evidence dates · 15
  1. The FOMC decision is scheduled for 2026-10-28 at 2:00 p.m. ET, followed by the Chair's press conference at 2:30 p.m. ET. The target range is 3.75%-4.00%, and contemporaneous futures-based sources indicated roughly a 90%-93% probability of no change.2026-10-07
  2. forex.tradingcharts.com2026-10-27
  3. eia.gov2026-10-21
  4. wdez.com2026-10-27T09:23:00-04:00
  5. eia.gov2026-10-21T00:00:00-04:00
  6. EIA tables reportedly show crude inputs of 16.649 million b/d, four-week refinery utilization of 93.0%, and four-week products supplied of 21.122 million b/d; these exact table values were not independently extracted during this check.2026-10-21T00:00:00-04:00
  7. EIA trade-flow tables reportedly show four-week petroleum exports of 11.674 million b/d and net petroleum imports of -4.118 million b/d; the exact values were not independently extracted during this check.2026-10-21T00:00:00-04:00
  8. commodityscope.com2026-10-26T00:00:00-04:00
  9. Reports describe continuing attacks and shipping disruption around Hormuz, while diplomatic developments have moderated crude prices; direct operational-flow and damage evidence remained incomplete.2026-10-27
  10. Houthis claimed attacks on Saudi East-West pipeline pumping stations and Riyadh airport, but Saudi confirmation and an authoritative damage assessment were unavailable.2026-10-26
  11. The U.S. Treasury announced sanctions on 2026-10-21 targeting Iranian shadow-fleet vessels, shipping agents, facilitators and associated financial relationships.2026-10-21
  12. NHC reported no active tropical cyclones in the Atlantic, Caribbean Sea or Gulf of America on 2026-10-27; Tropical Storm Vance was in the eastern North Pacific.2026-10-27
  13. December WTI was reported near $99.96 and down approximately 1.77% as diplomacy weighed on prices, despite continuing geopolitical supply risk.2026-10-27T13:58:00-05:00
  14. A third-party Hormuz tracker reported 20 crossings and approximately 0.22 million barrels outbound over the preceding 24 hours, but missing historical comparison fields prevent conclusions about normalization or collapse.2026-10-27T21:01:00Z
  15. tradingview.com2026-10-27

Free. Always. Futures trading edge in your inbox.

You're in. Watch your inbox.

We do not send junk mail. We do not spam.