Session Prep

Two minutes tonight. A plan tomorrow.
Morning review · Data as of Tue, Oct 27, 7:00 AM EDT · All times Eastern
Deep research

This morning's one thing

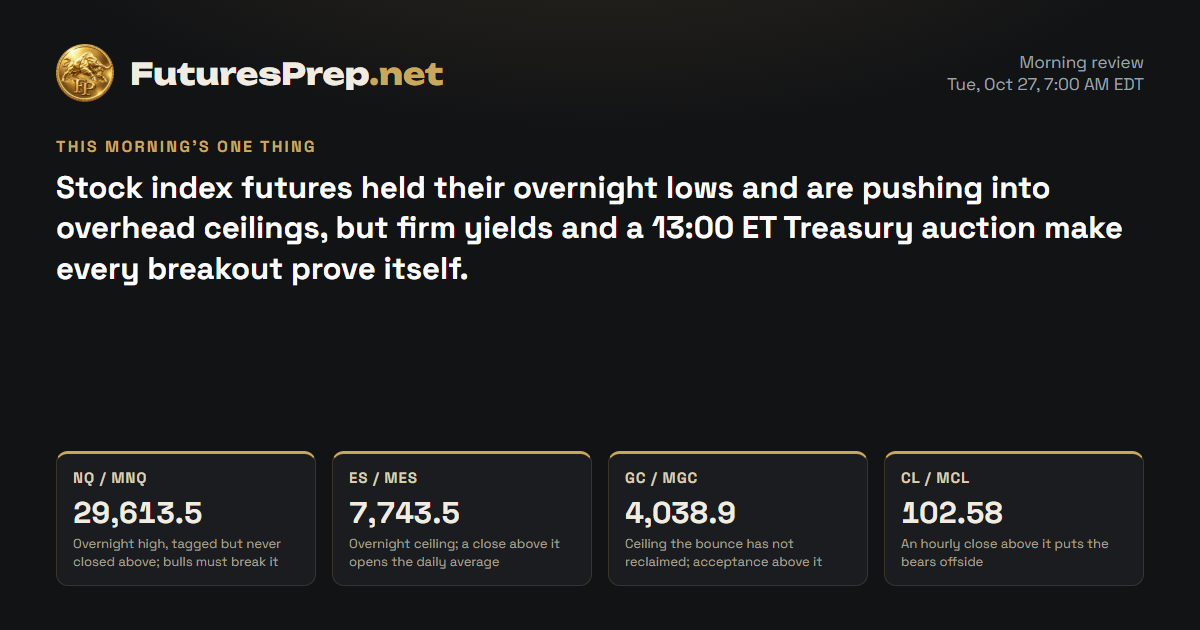
Stock index futures held their overnight lows and are pushing into overhead ceilings, but firm yields and a 13:00 ET Treasury auction make every breakout prove itself.

Today's market movers · Tuesday, October 27

Time ETImpactEventForecastPrevious
10:00 AMMediumCB Consumer Confidence81.281.9

U.S. releases, high and medium impact.

NQ / MNQE-mini / Micro E-mini Nasdaq-100Weekly thesis · STRESSED

The Lines in the Sand

29,613.5Overnight high, tagged but never closed above; bulls must break it
29,390Losing this turns the recovery into a sideways or lower grind
29,288.75Overnight floor where bears were thrown back

The Trap

Late bulls tend to chase the pop into 29613.50 before any hourly close above it, then get stuck if the high rejects again. Bears who pressed the overnight drop got run over off 29288.75.

Last price29,527.25
ADR · 30 sessions514.58 pts
Daily EMA2130,085.07BELOW
Reopen gapUP · 14.25 ptsFilled
29,00029,20029,40029,60029,80030,00030,200Tue 9:30close 16:00Wed 9:30close 16:00Thu 9:30close 16:00Fri 9:30close 16:00Mon 9:30close 16:00Prior week high · 30,114Prior week low · 28,986.25H1 · EMA21 · NQ / MNQ 29,527.25Dashed: last night's path
Overnight: held

The Read

Bears had last week's low at 28986.25 in sight and lost the fight at 29024. Bulls drove price back to 29466.75 on heavier than usual volume, and the hourly chart is holding above its rising average. The tell is the stall: tight hourly bars just under 29571.75, and the daily close still sits far below the 30085.07 EMA21. That is a recovery, not a reversal, and the mixed tech heavyweights plus a Fed decision Wednesday give the bears a real counter-argument. Hold above 29571.75 and the door opens toward last week's 30114 high; lose 29397 and the bounce fades into rotation, with 29024 the floor that matters.

Morning review · Oct 27, 7:30 AM EDT

Bears drove MNQ down to 29288.75 overnight and got nothing for it. Bulls pulled it back to 29527.25, above the rising hourly average, but the rally stalled at 29613.50 without closing above it. The daily chart still sits under its 30085.07 average, and firm Treasury yields plus a firmer dollar are the strongest case against the bounce. If price holds above 29390 and closes through 29613.50, the door opens; if it loses 29390, the overnight floor at 29288.75 is back in play.

Overnight evidence · 11 cited findings

Overnight price action

  • From the evening baseline, MNQ traded between 29288.75 and 29613.50 and gained 46.25 points.
  • Price fell below the prior 29397 invalidation reference intrabar but did not remain there, then reclaimed the H1 EMA21 and prior close.
  • The prior 06:00 projection was 29510 versus an observed 29527.25 close, while the projected NY-AM extension remains unresolved.
  • The opening gap at 29466.75 was filled overnight.

Overnight events

  • No scheduled FOMC decision occurred overnight; the meeting begins today and concludes October 28 (https://www.federalreserve.gov/newsevents/2026-october.htm).
  • No verified overnight exchange-direct positioning or order-book snapshot was available.
  • Secondary premarket evidence showed MNQ below 29613.50 before the report cutoff, so breakout confirmation remained pending (https://markets.businessinsider.com/premarket).

What changed

  • Price action remains bullish after the overnight recovery and H1 EMA21 reclaim.
  • The gap fill and completed 220-point expansion support momentum, but 0.631 ADR is already consumed.
  • Restrictive yields, a firmer dollar and mixed technology breadth oppose a smooth advance.
  • Net result: keep the bullish read unchanged, conditional on acceptance above 29613.50.
Yesterday's daily candle · Mon, Oct 26
Open29,268.5High29,571.75Low29,024Close29,466.75
bullish · range 547.75 pts
Projected range · next session485 pts29,325 – 29,810

Index drivers

The heavyweights split on Monday: NVIDIA, Microsoft, Broadcom and Tesla closed higher, and Tesla posted the biggest move. Apple, Meta and Alphabet closed lower, so the leaders did not all push in the same direction.

Market data as of Oct 27, 7:33 AM EDT · Weights as of 2026-09-30

Evidence · 11 cited findings

Price action · weekly / daily / H1

  • Weekly structure begins green after price defended 29024 near the 28986.25 prior-week low, but MNQ remains inside last week's range and has not accepted toward 30114.
  • The daily candle rallied from 29024 to 29466.75 on 1.243 times its 30-day average volume, while the close remained 1.202 ADR below the rejecting 30085.07 EMA21; this is a recovery, not a confirmed daily reversal.
  • H1 closed above its rising 29324.32 EMA following the 10:00 expansion and then consolidated beneath 29571.75; holding 29426 supports another test higher, while an H1 close below 29397 weakens the bullish path.
  • The projected path is 29420 at 22:00, 29510 at 06:00, 29720 at 10:00 and 29640 at the 16:00 resolution close.

Metrics

  • Monday used 1.064 ADR and closed bullish at 29466.75 after a 547.75-point range, demonstrating recovery demand but leaving much of the broader technical damage unrepaired.
  • The last completed H1 range was only 43.5 points versus a 105-point expansion threshold, so the next projected impulse is conditional on a close above 29571.75.
  • Major QQQ drivers were mixed: NVDA gained 2.3891%, MSFT 1.5424%, AVGO 2.3284% and TSLA 5.212%, while AAPL lost 1.0971%, META 1.8767% and GOOGL 1.0649%; weights are from Invesco and quotes are supplemental, not directional inputs (https://www.invesco.com/qqq-etf/en/about.html).
  • Primary CME data sufficient to reproduce every supplied bar, EMA and ADR value were not retrieved, so the technical path remains a model-generated hypothesis (https://www.cmegroup.com/market-data/settlements.html).

Sentiment & current events

  • Treasury's schedule supports 2-year, 5-year, FRN and 7-year supply this week, adding event risk, though exact auction times were not established from the reviewed source (https://fiscaldata.treasury.gov/datasets/upcoming-auctions/).
  • The wider central-bank cluster includes BoC and RBNZ Wednesday, ECB Thursday and BoJ Friday; exact market probabilities remain time-sensitive secondary estimates (https://www.newsquawk.com/daily/5825-week-in-focus-26-30th-october-2026-highlights-include-fomc-boc-rbnz-ecb-boj-policy-decisions-us-pce).
  • Sentiment evidence is mixed rather than unusually one-sided, and recent instrument-specific crowding could not be established from a defensible sample.
Sources & evidence dates · 28
  1. federalreserve.gov2025-06-24
  2. bea.gov2026-06-15
  3. fiscaldata.treasury.gov2026-10-23
  4. Reuters reported 28 confirmed or reported attacks in and around the Strait of Hormuz during October and 113 since the U.S.-Israeli war with Iran began. A syndicated Reuters copy says the tally broadly aligns with IMO data, but the underlying live incident database was not independently inspected.2026-10-23
  5. cmegroup.com
  6. Current discretionary commentary for MNQ, MES, MGC and MCL is mixed and conditional. TradingView and blog levels are observable published opinions, but their claimed liquidity, gamma, value-area and directional significance were not independently reproducible from primary CME data and cannot validate the price action forecasts.
  7. The global central-bank event cluster is supported by current schedules and previews: BoC and RBNZ decisions are due Wednesday, ECB Thursday and BoJ Friday. Exact market-implied probabilities and economist counts remain time-sensitive secondary estimates rather than primary-source facts.2026-10-23
  8. Yahoo2026-10-27T09:57:19.000Z
  9. Yahoo2026-10-27T09:35:01.000Z
  10. Yahoo2026-10-27T09:30:00.000Z
  11. Yahoo2026-10-27T11:15:50.000Z
  12. Yahoo2026-10-27T11:15:13.000Z
  13. Yahoo2026-10-27T11:00:00.000Z
  14. Yahoo2026-10-27T07:00:00.000Z
  15. Yahoo2026-10-27T05:07:00.000Z
  16. Yahoo2026-10-27T05:00:30.000Z
  17. Yahoo2026-10-27T09:15:00.000Z
  18. Yahoo2026-10-27T08:22:02.000Z
  19. Yahoo2026-10-27T03:21:13.000Z
  20. ChartMill2026-10-27T09:25:33.000Z
  21. Yahoo2026-10-27T09:23:01.000Z
  22. Yahoo2026-10-27T09:00:04.000Z
  23. Yahoo2026-10-27T09:07:33.000Z
  24. Yahoo2026-10-27T08:50:02.000Z
  25. Yahoo2026-10-27T08:19:01.000Z
  26. Yahoo2026-10-27T06:22:02.000Z
  27. Yahoo2026-10-27T09:20:02.000Z
  28. Yahoo2026-10-27T09:08:34.000Z
ES / MESE-mini / Micro E-mini S&P 500Weekly thesis · STRESSED

The Lines in the Sand

7,743.5Overnight ceiling; a close above it opens the daily average
7,706.75Losing it turns the recovery into back-and-forth chop
7,699.75Overnight low where the sellers ran out of push

The Trap

The pop to 7743.50 slipped right back, and that kind of failed push is where breakout chasers tend to get caught. Shorts who leaned on the overnight dip were squeezed off 7699.75.

Last price7,731.75
ADR · 30 sessions81.28 pts
Daily EMA217,763.76BELOW
Reopen gapNo opening gap
7,6407,6607,6807,7007,7207,7407,7607,7807,8007,820Tue 9:30close 16:00Wed 9:30close 16:00Thu 9:30close 16:00Fri 9:30close 16:00Mon 9:30close 16:00Prior week high · 7,811.75Prior week low · 7,648.5H1 · EMA21 · ES / MES 7,731.75Dashed: last night's path
Overnight: held

The Read

Bears tested last week's floor and came up short at 7651.75, just above the 7648.5 prior-week low. Bulls answered with a green close at 7714.25 on above-average volume, and the hourly chart is holding above its average. The fight has gone quiet since: momentum stalled under 7739.5, and price still sits below the 7763.76 EMA21 that turned it away. Monday also used up a big chunk of its normal range, which is the strongest case against a clean run higher. Hold above 7739.5 and the door opens toward 7760-7780; lose 7702.75 and 7688 comes into view, with bulls offside.

Morning review · Oct 27, 7:30 AM EDT

Bears pushed MES to 7699.75 overnight and stalled there. Bulls lifted it back to 7731.75, above the rising hourly average, but the rally to 7743.50 got turned back before it could break out. Firm yields and a firmer dollar are the main argument against the bounce, and price is still stuck inside last week's 7648.50-7811.75 range. If price holds above 7706.75 and closes over 7743.50, the daily average near 7763.76 comes into reach; if it loses 7706.75, the recovery fades into chop.

Overnight evidence · 11 cited findings

Overnight price action

  • From the evening baseline, MES traded between 7699.75 and 7743.50 and gained 16.25 points.
  • Price remained above the prior 7702.75 invalidation reference on a closing basis and recovered above the H1 EMA21.
  • The observed 06:00 close of 7731.75 was close to the prior 7722 projection, while the projected NY-AM extension remains unresolved.
  • No current-session opening gap was present.

Overnight events

  • No scheduled FOMC decision occurred overnight; the meeting begins today and concludes October 28 (https://www.federalreserve.gov/newsevents/2026-october.htm).
  • No verified live overnight positioning or exchange-direct settlement snapshot was available.
  • Secondary early-price evidence remained below 7743.50, so breakout confirmation was pending at that observation time (https://markets.businessinsider.com/premarket).

What changed

  • Price action remains bullish after the overnight defense and H1 EMA21 reclaim.
  • The latest expansion and proximity to 7743.50 support another upside attempt.
  • Mixed breadth, restrictive yields and an already-used 0.538 ADR cap confidence.
  • Net result: keep the bullish read unchanged, conditional on acceptance above 7743.50.
Yesterday's daily candle · Mon, Oct 26
Open7,689.75High7,739.5Low7,651.75Close7,714.25
bullish · range 87.75 pts
Projected range · next session82 pts7,689.5 – 7,771.5

Index drivers

Chipmakers led Monday: NVIDIA, Broadcom, Micron and AMD all closed higher, along with Microsoft, Amazon, Tesla and Berkshire Hathaway. Apple, Meta and both Alphabet share classes closed lower, so the biggest names were split.

Market data as of Oct 27, 7:33 AM EDT · Weights as of 2026-10-01

Evidence · 11 cited findings

Price action · weekly / daily / H1

  • Weekly price is green after recovering from 7651.75, marginally above the 7648.5 prior-week low, but remains contained below the 7811.75 prior-week high.
  • The daily candle closed bullish at 7714.25 on 1.223 times average volume, while remaining 0.609 ADR below the rejecting 7763.76 EMA21; recovery demand is present without a confirmed daily reversal.
  • The projected path is 7708 at 22:00, 7722 at 06:00, 7761 at 10:00 and 7748 at the 16:00 resolution close.

Metrics

  • Monday used 1.08 ADR in an 87.75-point range and recovered 62.5 points from the session low, supporting demand but also showing that substantial range was already consumed.
  • The last completed H1 range was 5 points versus an 18.5-point expansion threshold, making the next impulse conditional on a close above 7739.5.
  • Major SPY drivers were mixed: NVDA, MSFT, AVGO, TSLA, MU and AMD rose, while AAPL, META and both Alphabet share classes fell; weights are supplemental and do not alter price action direction (https://www.ssga.com/us/en/intermediary/etfs/state-street-spdr-sp-500-etf-trust-spy).

Sentiment & current events

  • The FOMC meets October 27-28, with the decision and press conference after this forecast window on October 28 (https://www.federalreserve.gov/newsevents/2026-october.htm).
  • Advance Q3 GDP and September Personal Income and Outlays arrive October 29 at 08:30 ET; supplied consensus values were not primary-source verified (https://www.bea.gov/news/schedule?year=2026).
  • Treasury supply and the BoC, RBNZ, ECB and BoJ decision cluster increase cross-asset event risk later in the week (https://www.newsquawk.com/daily/5825-week-in-focus-26-30th-october-2026-highlights-include-fomc-boc-rbnz-ecb-boj-policy-decisions-us-pce).
  • No tropical systems or local impacts were monitored in the October 26 NWS Jacksonville briefing, but its limited geography cannot establish all Gulf-wide weather risk (https://www.weather.gov/media/jax/briefings/nws-jax-briefing.pdf).
  • Current social and positioning evidence is mixed, incomplete and insufficient to confirm unusual crowding.
Sources & evidence dates · 39
  1. federalreserve.gov2025-06-24
  2. bea.gov2026-06-15
  3. fiscaldata.treasury.gov2026-10-23
  4. Reuters reported 28 confirmed or reported attacks in and around the Strait of Hormuz during October and 113 since the U.S.-Israeli war with Iran began. A syndicated Reuters copy says the tally broadly aligns with IMO data, but the underlying live incident database was not independently inspected.2026-10-23
  5. The NWS Jacksonville briefing issued October 26 lists no monitored tropical systems and no expected local tropical impacts. This supports the narrower conclusion that no tropical threat was identified in that briefing, but it is not by itself a complete Gulf-wide hurricane assessment.2026-10-26
  6. cmegroup.com
  7. Current discretionary commentary for MNQ, MES, MGC and MCL is mixed and conditional. TradingView and blog levels are observable published opinions, but their claimed liquidity, gamma, value-area and directional significance were not independently reproducible from primary CME data and cannot validate the price action forecasts.
  8. The global central-bank event cluster is supported by current schedules and previews: BoC and RBNZ decisions are due Wednesday, ECB Thursday and BoJ Friday. Exact market-implied probabilities and economist counts remain time-sensitive secondary estimates rather than primary-source facts.2026-10-23
  9. Yahoo2026-10-27T09:57:19.000Z
  10. Yahoo2026-10-27T09:35:01.000Z
  11. Yahoo2026-10-27T09:30:00.000Z
  12. Yahoo2026-10-27T11:15:50.000Z
  13. Yahoo2026-10-27T11:15:13.000Z
  14. Yahoo2026-10-27T11:00:00.000Z
  15. Yahoo2026-10-27T07:00:00.000Z
  16. Yahoo2026-10-27T05:07:00.000Z
  17. Yahoo2026-10-27T05:00:30.000Z
  18. Yahoo2026-10-27T09:15:00.000Z
  19. Yahoo2026-10-27T08:22:02.000Z
  20. Yahoo2026-10-27T03:21:13.000Z
  21. ChartMill2026-10-27T09:25:33.000Z
  22. Yahoo2026-10-27T09:23:01.000Z
  23. Yahoo2026-10-27T09:00:04.000Z
  24. Yahoo2026-10-27T09:07:33.000Z
  25. Yahoo2026-10-27T08:50:02.000Z
  26. Yahoo2026-10-27T08:19:01.000Z
  27. Yahoo2026-10-27T06:22:02.000Z
  28. Yahoo2026-10-27T09:20:02.000Z
  29. Yahoo2026-10-27T09:08:34.000Z
  30. Yahoo2026-10-27T11:00:00.000Z
  31. Yahoo2026-10-27T10:30:00.000Z
  32. Yahoo2026-10-27T10:05:00.000Z
  33. Yahoo2026-10-27T08:51:00.000Z
  34. Yahoo2026-10-27T07:51:00.000Z
  35. Yahoo2026-10-27T07:43:33.000Z
  36. SeekingAlpha2026-10-27T05:32:00.000Z
  37. Yahoo2026-10-27T09:26:02.000Z
  38. Yahoo2026-10-27T06:20:00.000Z
  39. Yahoo2026-10-27T02:45:00.000Z
GC / MGCGold / Micro GoldWeekly thesis · STRESSED

The Lines in the Sand

4,038.9Ceiling the bounce has not reclaimed; acceptance above it ends the slide
4,001.6Overnight low; an hourly close below it reopens downside
3,989Last week's low, the next floor if 4001.60 breaks

The Trap

Shorts pressing the bounce just under 4038.90 can get squeezed when dip demand shows up. Bulls treating 4001.60 as a guaranteed floor already watched it get tested hard overnight.

Last price4,021.6
ADR · 30 sessions77.66 pts
Daily EMA214,167.55BELOW
Reopen gapNo opening gap
3,9804,0004,0204,0404,0604,0804,1004,1204,1404,1604,180Tue 8:20close 13:30Wed 8:20close 13:30Thu 8:20close 13:30Fri 8:20close 13:30Mon 8:20close 13:30Prior week low · 3,989H1 · EMA21 · GC / MGC 4,021.6Dashed: last night's path
Overnight: invalidated

The Read

INVALIDATED

Neither side has control. Bears pushed toward last week's 3989 low and stalled at 3991.1, and bulls lifted price to a modest green close at 4031 but failed at 4044.3. Volume was light and the day used less than its usual range, so the bounce carries little conviction. Safe-haven demand from the Hormuz attacks supports gold, while the unresolved daily downtrend and a possible move in yields or the dollar around the Fed push back. Accept above 4044.3 and the door opens higher; accept below 3991.1 and the floor at 3989 is all that's left.

Morning review · Oct 27, 7:30 AM EDT

Bears knocked gold down to 4001.60 overnight, then dip demand bounced it to 4021.60, right back to the hourly average. The bounce has not reclaimed the 4030-4039 resistance zone, and the daily trend still slopes down under 4167.55. The strongest counter-argument is record ETF holdings worldwide and in China, which keep dip demand alive, so neither side owns this tape. If price is accepted above 4038.90, the slide is done; if an hourly bar closes below 4001.60, last week's low at 3989 is back in play.

Overnight evidence · 11 cited findings

Overnight price action

  • From the evening baseline, MGC traded between 4001.60 and 4038.90 and lost 10.40 points.
  • The observed 06:00 close of 4021.60 was 15.40 points below the prior 4037 projection.
  • Price tested the lower half of the prior 3991.10-4044.30 rotation area and returned only to its H1 EMA21.
  • The prior flat path is no longer controlling; 4001.60 is the new downside confirmation level.

Overnight events

  • No scheduled FOMC decision occurred overnight; the decision remains due October 28 (https://www.federalreserve.gov/newsevents/2026-october.htm).
  • No authoritative same-time real-yield or primary positioning snapshot was available.
  • Verified ETF-flow evidence is supportive but is monthly rather than intraday (https://www.gold.org/goldhub/research/gold-etfs-holdings-and-flows/2026/10).

What changed

  • Price action changes from flat to bearish and invalidates the evening rotation read.
  • The daily downtrend, bearish candle and failure below 4030-4039 support downside continuation.
  • Record ETF demand materially opposes the read and reduces confidence in an uninterrupted decline.
  • Net result: bearish while below 4030-4039, with confirmation on a close below 4001.60.
Yesterday's daily candle · Mon, Oct 26
Open4,012.1High4,044.3Low3,991.1Close4,031
bullish · range 53.2 pts
Projected range · next session62 pts3,998 – 4,060
⚠ Flat / choppy conditions likely
Evidence · 10 cited findings

Price action · weekly / daily / H1

  • Weekly price is modestly green after holding 3991.1 just above the 3989 prior-week low, but remains deep inside the prior-week range and well below 4211.2.
  • The daily candle closed bullish at 4031 but used only 0.685 ADR on 0.737 times average volume and remained 1.758 ADR beneath the rejecting 4167.55 EMA21, leaving the larger decline unresolved.
  • H1 recovered its 4027.19 EMA and compressed into the close after failing at 4044.3; rotation around 4030 remains favored until either 4044.3 or 3991.1 breaks with acceptance.
  • The projected path is 4022 at 22:00, 4037 at 06:00, 4052 at 10:00 and 4026 at the 16:00 resolution close.

Metrics

  • Monday's 53.2-point range was only 0.685 ADR, leaving room for expansion but providing little directional confirmation.
  • The last completed H1 range was 6.6 points versus a 23.9-point expansion threshold, with six bars since the last expansion.

Sentiment & current events

  • The FOMC decision is scheduled for October 28 after this forecast window, creating rate and dollar uncertainty without an immediate scheduled overnight catalyst (https://www.federalreserve.gov/newsevents/2026-october.htm).
  • The BoC, RBNZ, ECB and BoJ decision cluster adds global rate and currency uncertainty later in the week (https://www.newsquawk.com/daily/5825-week-in-focus-26-30th-october-2026-highlights-include-fomc-boc-rbnz-ecb-boj-policy-decisions-us-pce).
  • Reported Hormuz attacks provide safe-haven support, but the underlying incident database was not independently audited (https://www.reuters.com/business/energy/ship-attacks-strait-hormuz-hit-record-high-october-2026-10-23/).
  • Current real-yield, dollar, ETF-flow, central-bank-buying and CFTC observations were not fully refreshed, preventing a stronger sentiment conclusion.
Sources & evidence dates · 8
  1. federalreserve.gov2025-06-24
  2. bea.gov2026-06-15
  3. fiscaldata.treasury.gov2026-10-23
  4. Reuters reported 28 confirmed or reported attacks in and around the Strait of Hormuz during October and 113 since the U.S.-Israeli war with Iran began. A syndicated Reuters copy says the tally broadly aligns with IMO data, but the underlying live incident database was not independently inspected.2026-10-23
  5. reuters.com2026-10-26
  6. cmegroup.com
  7. Current discretionary commentary for MNQ, MES, MGC and MCL is mixed and conditional. TradingView and blog levels are observable published opinions, but their claimed liquidity, gamma, value-area and directional significance were not independently reproducible from primary CME data and cannot validate the price action forecasts.
  8. The global central-bank event cluster is supported by current schedules and previews: BoC and RBNZ decisions are due Wednesday, ECB Thursday and BoJ Friday. Exact market-implied probabilities and economist counts remain time-sensitive secondary estimates rather than primary-source facts.2026-10-23
CL / MCLWTI Crude Oil / Micro WTI Crude OilWeekly thesis · STRESSED

The Lines in the Sand

102.58An hourly close above it puts the bears offside
102.81Where the overnight rebound ran out of gas
100.6Overnight low; a close below it opens 99.80-100.00

The Trap

This week the swings have been fast in both directions, and the people who chase a flush toward 100.60 tend to get caught by the snap-back. Late moves in the middle of the range get punished the most.

Last price101.25
ADR · 30 sessions3.69 pts
Daily EMA2195.01ABOVE
Reopen gapNo opening gap
9596979899100101102103104Tue 9:00close 14:30Wed 9:00close 14:30Thu 9:00close 14:30Fri 9:00close 14:30Mon 9:00close 14:30Prior week high · 103.93Prior week low · 95.26H1 · EMA21 · CL / MCL 101.25Dashed: last night's path

The Read

Bulls ran crude to 103.13 and got hit with a wall of supply, closing red at 101.27 on volume far above normal. The hourly chart made lower highs into the close and finished below its average, so bears have the short-term edge. The bigger picture argues back: price is still well above the rising 95.01 EMA21, Hormuz shipping risk is acute, and OPEC is keeping production restrained. That makes this a pullback inside an uptrend, not a broken trend. Stay below 102.27 and a retest of 100.33 is on the table, with 99.70-99.00 behind it; reclaim 102.27 and the bears are offside.

Morning review · Oct 27, 7:30 AM EDT

Bulls tried to rescue crude off 100.60 overnight and ran out of gas at 102.81. Price slid back to 101.25, below the hourly average at 101.49 and under the weekly open at 102.55, so the tilt leans slightly lower. The other side has real fuel: a 3.1-million-barrel crude inventory draw, Middle East shipping risk, and a daily average at 95.01 that is still rising. If an hourly bar closes above 102.58, the bears are offside; if one closes below 100.60, the 99.80-100.00 pocket opens.

Overnight evidence · 11 cited findings

Overnight price action

  • From the evening baseline, MCL traded between 100.60 and 102.81 and was nearly unchanged, losing 0.07 points.
  • The observed 06:00 close of 101.25 was above the prior projected 100.82, and the anticipated overnight slide did not fully develop.
  • Price temporarily recovered above the prior 102.27 invalidation reference but failed at 102.81 and subsequently closed below the H1 EMA21.
  • The 103.43 gap remains unfilled.

Overnight events

  • No routine EIA report occurred overnight; the next weekly report is scheduled for October 28 (https://www.eia.gov/petroleum/supply/weekly/pdf/table9.pdf).
  • NHC reported no active Atlantic tropical cyclones at 08:00 ET (https://www.nhc.noaa.gov/).
  • No comprehensive live maritime incident feed or current primary oil-positioning snapshot was available.

What changed

  • Price action remains bearish, but the overnight delay requires an adjusted verdict.
  • Failure at 102.81 and the close below the H1 EMA21 support another test of 100.60.
  • The verified inventory draw and geopolitical supply risk materially oppose the bearish read.
  • Net result: bearish correction only after confirmation below 100.60; recovery above 102.58 weakens the scenario.
Yesterday's daily candle · Mon, Oct 26
Open102.55High103.13Low100.33Close101.27
bearish · range 2.8 pts
Projected range · next session3 pts99.35 – 102.35
Evidence · 11 cited findings

Price action · weekly / daily / H1

  • Weekly price is red after rejecting below the prior-week high and closing 2.16 beneath the 103.43 prior-week close; the untouched 95.26 prior-week low remains distant, so the read is corrective rather than a full structural reversal.
  • The daily candle closed bearish at 101.27 on 3.733 times average volume and well off 103.13, while still standing 1.696 ADR above the rising 95.01 EMA21; immediate distribution conflicts with strong higher-timeframe trend support.
  • The projected path is 101.55 at 22:00, 100.82 at 06:00, 99.68 at 10:00 and 100.15 at the 16:00 resolution close.

Metrics

  • Monday used 0.759 ADR in a 2.80-point range, leaving room for further movement after a bearish close on exceptionally elevated relative volume.
  • The last completed H1 range was 0.42 versus a 0.82 expansion threshold, and the preferred expansion requires an H1 close below 100.33.
  • The current 103.43 downside-gap inventory is projected to remain unfilled during this session because the price action path points toward 100.33 and below.
  • Primary exchange data did not independently confirm the exact October 26 settlement or all supplied MCL technical values (https://www.cmegroup.com/market-data/settlements.html).

Sentiment & current events

  • Reuters reported acute Hormuz shipping risk, with 28 confirmed or reported October attacks and 113 since the wider conflict began; the underlying live database was not independently audited (https://www.reuters.com/business/energy/ship-attacks-strait-hormuz-hit-record-high-october-2026-10-23/).
  • OPEC participants maintained September production requirements for November, providing supply restraint that opposes the bearish price action read (https://www.opec.org/pr-detail/616-4-october-2026.html).
  • EIA reported October 16 commercial crude inventories at 412.5 million barrels after a 3.1-million-barrel decline; the competing 423.4-million and 0.6-million-decline figures were stale, and the next report is due October 28 (https://www.eia.gov/petroleum/supply/weekly/pdf/highlights.pdf).
  • The October 26 NWS Jacksonville briefing monitored no tropical systems or local impacts, but its geographic scope cannot rule out all Gulf-wide infrastructure weather risk (https://www.weather.gov/media/jax/briefings/nws-jax-briefing.pdf).
Sources & evidence dates · 9
  1. federalreserve.gov2025-06-24
  2. bea.gov2026-06-15
  3. The EIA report for the week ended October 16 shows commercial crude inventories of 412.5 million barrels, down 3.1 million from 415.6 million; gasoline fell to 205.3 million and distillates rose to 104.3 million. The separate supplied claim of a 0.6-million-barrel decline to 423.4 million for that week is stale and incorrect.2026-10-21
  4. The next routine EIA Weekly Petroleum Status Report is scheduled for October 28, 2026. OPEC states that its participating countries maintained September production requirements for November and that their next review meeting is November 1.2026-10-04
  5. publications.opec.org2026-10-13
  6. Reuters reported 28 confirmed or reported attacks in and around the Strait of Hormuz during October and 113 since the U.S.-Israeli war with Iran began. A syndicated Reuters copy says the tally broadly aligns with IMO data, but the underlying live incident database was not independently inspected.2026-10-23
  7. The NWS Jacksonville briefing issued October 26 lists no monitored tropical systems and no expected local tropical impacts. This supports the narrower conclusion that no tropical threat was identified in that briefing, but it is not by itself a complete Gulf-wide hurricane assessment.2026-10-26
  8. cmegroup.com
  9. Current discretionary commentary for MNQ, MES, MGC and MCL is mixed and conditional. TradingView and blog levels are observable published opinions, but their claimed liquidity, gamma, value-area and directional significance were not independently reproducible from primary CME data and cannot validate the price action forecasts.

Free. Always. Futures trading edge in your inbox.

You're in. Watch your inbox.

We do not send junk mail. We do not spam.