Session Prep

Two minutes tonight. A plan tomorrow.
Morning review · Data as of Mon, Oct 26, 7:00 AM EDT · All times Eastern
Deep research

This morning's one thing

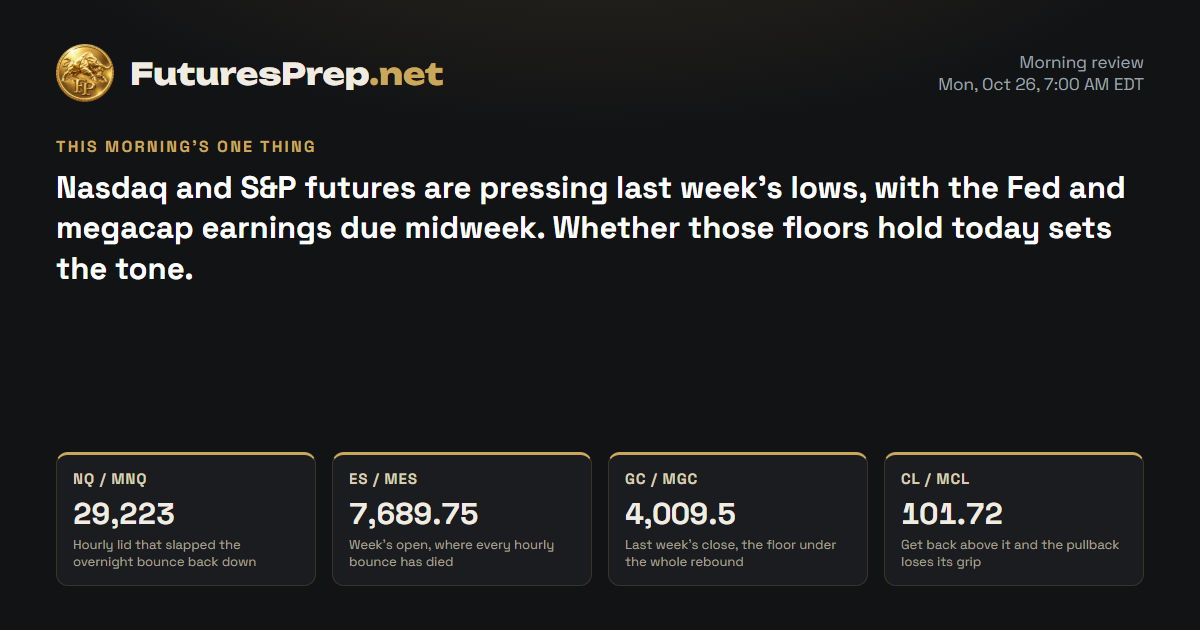
Nasdaq and S&P futures are pressing last week's lows, with the Fed and megacap earnings due midweek. Whether those floors hold today sets the tone.

Today's market movers · Monday, October 26

No major U.S. releases or tracked driver earnings scheduled.

U.S. releases, high and medium impact.

NQ / MNQE-mini / Micro E-mini Nasdaq-100Weekly thesis · FULFILLED

The Lines in the Sand

29,223Hourly lid that slapped the overnight bounce back down
29,024Overnight floor; an hourly close under it opens the trapdoor
28,986.25Last week's low, the real floor still unbroken

The Trap

The bounce off 29024 looked like a floor until it got slapped down from 29223, leaving the dip chasers offside. The mirror trap is late shorts piling on right above 28986.25 with the Fed and megacap earnings close enough to spark a squeeze.

Last price29,089.25
ADR · 30 sessions512.92 pts
Daily EMA2130,147.37BELOW
Reopen gapUP · 91.5 ptsFilled
29,00029,20029,40029,60029,80030,00030,200Mon 9:30close 16:00Tue 9:30close 16:00Wed 9:30close 16:00Thu 9:30close 16:00Fri 9:30close 16:00Prior week high · 30,114Prior week low · 28,986.25H1 · EMA21 · NQ / MNQ 29,089.25Dashed: last night's path
Overnight: held

The Read

Bears took the prior-week low at 29268.75 and made it stick, closing the week at 29177, under last week's close. Bulls fought back from 28986.25 on Friday, but the bounce stalled at 29325.75 and the hourly chart is still pinned under a falling average. The tell is mixed: Microsoft held up while most heavyweights slipped, crowded fear leaves room for a short-covering snap, and the Sunday reopen can reprice Friday's picture fast. With the Fed decision on Wednesday, the tilt is only slightly to the downside. An hourly close above 29325.75 puts the bears offside; lose 28986.25 and the floor is gone.

Morning review · Oct 26, 7:30 AM EDT

Bears have the edge, but the fight isn't settled. Price opened the week at 29268.50, got rejected at 29345.25 and slid to 29024, then an hourly bounce stalled at 29223 and faded back to 29089.25, below last week's 29177 close and far beneath the daily average at 30147.37. Last week's 28986.25 low hasn't broken yet, and a dovish Fed or strong Microsoft and Alphabet results could flip the tape fast. Lose 29024 on an hourly close and 28986.25 is next in the crosshairs; get back above 29223 and the downside case loses its teeth.

Overnight evidence · 9 cited findings

Overnight price action

  • MNQ traded from a 29345.25 overnight high to a 29024 low and was at 29089.25 at the observation cutoff.
  • Net change from the prior-evening baseline was -179.25 points across a 321.25-point range.
  • The prior 29177 close was crossed, so the upward opening gap was filled.
  • The latest completed H1 bar fell from 29222.75 to 29089.25 and exceeded the 105-point expansion threshold.

Overnight events

  • The market was repricing ahead of the October 27-28 FOMC meeting: https://www.federalreserve.gov/newsevents/2026-october.htm

What changed

  • Price action retains the prior bearish direction.
  • Overnight net decline, active hourly expansion and price below both trend measures support the read.
  • The filled gap removes one upside attraction but does not independently determine direction.
  • Pending Fed and megacap events oppose confidence because they could generate a rapid reversal.
Yesterday's daily candle · Fri, Oct 23
Open29,113High29,325.75Low28,986.25Close29,177
bullish · range 339.5 pts
Projected range · next session390 pts28,920 – 29,310

Index drivers

In Friday's closing quotes, the latest in the snapshot, most Nasdaq heavyweights finished lower: NVIDIA, Apple, Amazon, Meta, Broadcom, Alphabet and Tesla all slipped. Microsoft was the lone big name to close higher. Morning headlines point to Alphabet's Oct. 28 numbers and Amazon's Oct. 29 results as the next big tests.

Market data as of Oct 26, 7:33 AM EDT · Weights as of 2026-09-30

Evidence · 10 cited findings

Price action · weekly / daily / H1

  • Weekly structure is bearish despite the doji body: MNQ swept and accepted below the prior-week 29268.75 low and closed at 29177, beneath the prior 29389.75 close; 29268.75-29389.75 is overhead supply.
  • Daily price rejected the 30147.37 EMA21 and closed 1.892 ADR below it. The small bullish body recovered from 28986.25 but failed to sustain the rebound above 29325.75.
  • H1 closed at 29177 below its falling 29198.53 EMA21 after a multi-session decline. A close below 28986.25 supports expansion, while an H1 close above 29325.75 weakens the bearish scenario.

Metrics

  • Friday's range used 66.2% of the 512.92-point ADR, leaving room for renewed movement after late-session compression.
  • The last completed H1 range was 57.25 points versus a 105-point expansion threshold, so expansion was not active at the close.
  • Friday volume was 1.347 times its 30-session average, adding weight to the rejection but not independently determining direction.
  • Top-weight QQQ drivers were mixed Friday: MSFT gained 0.6582%, while NVDA, AAPL, AMZN, META, AVGO, GOOGL and TSLA declined; weights source: https://www.invesco.com/qqq-etf/en/about.html

Sentiment & current events

  • The verified FOMC meeting is October 27-28, with the decision at 2:00 p.m. ET and press conference at 2:30 p.m. ET on October 28: https://www.federalreserve.gov/newsevents/2026-october.htm
  • Bearish retail sentiment creates short-covering risk, particularly because broader-market breadth was reportedly healthier than technology-heavy indexes; no verified positioning or dealer-gamma data were available.
  • Weekend closure leaves the Friday market snapshot vulnerable to immediate repricing when Sunday futures reopen.
Sources & evidence dates · 24
  1. federalreserve.gov2025-06-24
  2. bea.gov2026-06-15
  3. bea.gov2026-09-30
  4. home.treasury.gov2026-10-23
  5. federalreserve.gov2026-10-07
  6. federalreserve.gov2026-10-07
  7. The WSB aggregator's fear scores and anecdotes lack an inspectable sample and methodology. Under the stated evidence rules, they cannot provide directional evidence for any symbol.2026-10-25T17:12:00-04:00
  8. Yahoo2026-10-26T09:46:54.000Z
  9. Yahoo2026-10-26T09:30:01.000Z
  10. Yahoo2026-10-26T09:26:02.000Z
  11. Yahoo2026-10-26T08:47:26.000Z
  12. Yahoo2026-10-26T07:11:52.000Z
  13. Yahoo2026-10-26T07:11:49.000Z
  14. Yahoo2026-10-26T08:44:00.000Z
  15. Yahoo2026-10-26T08:33:02.000Z
  16. Yahoo2026-10-26T09:20:06.000Z
  17. Yahoo2026-10-26T09:00:00.000Z
  18. Yahoo2026-10-26T05:06:25.000Z
  19. Yahoo2026-10-26T05:06:06.000Z
  20. Yahoo2026-10-25T16:01:03.000Z
  21. Yahoo2026-10-26T07:59:00.000Z
  22. Yahoo2026-10-26T07:33:21.000Z
  23. Yahoo2026-10-26T06:00:58.000Z
ES / MESE-mini / Micro E-mini S&P 500Weekly thesis · FULFILLED

The Lines in the Sand

7,689.75Week's open, where every hourly bounce has died
7,651.75Overnight low; an hourly close under it exposes 7625-7635
7,648.5Last week's low, the floor bears are leaning on

The Trap

Every push into 7686-7690 has looked like a turn and failed, leaving early bulls offside each time. The flip side is a crowd leaning hard on 7648.50 heading into Fed week, where a short squeeze can come from nowhere.

Last price7,663.25
ADR · 30 sessions80.3 pts
Daily EMA217,768.75BELOW
Reopen gapUP · 17.5 ptsFilled
7,6407,6607,6807,7007,7207,7407,7607,7807,8007,820Mon 9:30close 16:00Tue 9:30close 16:00Wed 9:30close 16:00Thu 9:30close 16:00Fri 9:30close 16:00Prior week high · 7,811.75Prior week low · 7,648.5H1 · EMA21 · ES / MES 7,663.25Dashed: last night's path
Overnight: held

The Read

Bears pushed through last week's 7676 low and held price under it, closing at 7672.25. Bulls never got back to Friday's 7706 open, and the hourly chart printed lower highs and lower lows under a falling average. The counterweight is real: equal-weight and small caps reportedly held up better, and crowded fear can fuel a squeeze, so the downside tilt is there but not loud. Accept above 7714.5 and the bears are offside; close under 7648.5 and the floor is gone.

Morning review · Oct 26, 7:30 AM EDT

Bulls keep knocking on 7689.75 and keep getting turned away. Price opened the week there, peaked at 7698.5 and ground down to 7663.25, below last week's 7672.25 close and the hourly average at 7676.81. The counterpunch is real: the Fed decision and Microsoft, Alphabet and Amazon earnings can unwind this pressure in a single headline. An hourly close under 7651.75 puts 7625-7635 in play; acceptance back above 7689.75 and the breakdown story falls apart.

Overnight evidence · 9 cited findings

Overnight price action

  • MES traded from a 7698.5 overnight high to a 7651.75 low and was at 7663.25 at the observation cutoff.
  • Net change from the prior-evening baseline was -26.5 points across a 46.75-point range.
  • The prior 7672.25 close was crossed, filling the upward opening gap.
  • The latest completed H1 bar fell from 7686.25 to 7663.25 and exceeded the 18.5-point expansion threshold.

Overnight events

  • The market was repricing ahead of the October 27-28 FOMC meeting: https://www.federalreserve.gov/newsevents/2026-october.htm

What changed

  • Price action retains the prior bearish direction.
  • The overnight decline, active hourly expansion and closes below both trend measures support the read.
  • The filled gap removes one upside attraction but does not independently determine direction.
  • Fed and megacap event risk opposes confidence because it could generate a sharp recovery.
Yesterday's daily candle · Fri, Oct 23
Open7,706High7,714.5Low7,648.5Close7,672.25
bearish · range 66 pts
Projected range · next session64 pts7,638 – 7,702

Index drivers

In Friday's closing quotes, the latest in the snapshot, the biggest S&P weights mostly finished lower: NVIDIA, Apple, Amazon, Meta, Broadcom, both Alphabet share classes, Tesla and Berkshire all slipped. Microsoft, Micron and AMD went the other way and closed higher. The snapshot lists AMD earnings after the close on Nov. 3.

Market data as of Oct 26, 7:33 AM EDT · Weights as of 2026-10-01

Evidence · 9 cited findings

Price action · weekly / daily / H1

  • Weekly price swept and accepted below the prior-week 7676 low and closed at 7672.25; the doji label masks a failed recovery beneath former support.
  • Friday produced a bearish daily candle with a 0.511 body ratio, closed 1.202 ADR beneath the 7768.75 EMA21 and failed to recover its 7706 open.
  • H1 closed at 7672.25 below its declining 7686.02 EMA21 after lower highs and lows. A close below 7648.5 supports expansion, while acceptance above 7714.5 negates the near-term bearish path.

Metrics

  • Friday used 82.2% of the 80.3-point ADR, showing meaningful downside participation without fully exhausting the typical range.
  • The last H1 range was 14.5 points versus an 18.5-point expansion threshold, so expansion was not active at the close.
  • Friday volume was 1.233 times the 30-session average, modestly supporting the bearish rejection.
  • Major SPY drivers were mixed Friday: MSFT, MU and AMD gained while NVDA, AAPL, AMZN, META, AVGO and both Alphabet share classes declined; weights source: https://www.ssga.com/us/en/intermediary/etfs/state-street-spdr-sp-500-etf-trust-spy

Sentiment & current events

  • The verified FOMC meeting is October 27-28, with the decision at 2:00 p.m. ET and press conference at 2:30 p.m. ET on October 28: https://www.federalreserve.gov/newsevents/2026-october.htm
  • Bearish retail sentiment creates short-covering risk, while reported equal-weight and small-cap resilience limits the systemic bearish interpretation.
Sources & evidence dates · 29
  1. federalreserve.gov2025-06-24
  2. bea.gov2026-06-15
  3. bea.gov2026-09-30
  4. home.treasury.gov2026-10-23
  5. federalreserve.gov2026-10-07
  6. federalreserve.gov2026-10-07
  7. The WSB aggregator's fear scores and anecdotes lack an inspectable sample and methodology. Under the stated evidence rules, they cannot provide directional evidence for any symbol.2026-10-25T17:12:00-04:00
  8. Yahoo2026-10-26T09:46:54.000Z
  9. Yahoo2026-10-26T09:30:01.000Z
  10. Yahoo2026-10-26T09:26:02.000Z
  11. Yahoo2026-10-26T08:47:26.000Z
  12. Yahoo2026-10-26T07:11:52.000Z
  13. Yahoo2026-10-26T07:11:49.000Z
  14. Yahoo2026-10-26T08:44:00.000Z
  15. Yahoo2026-10-26T08:33:02.000Z
  16. Yahoo2026-10-26T09:20:06.000Z
  17. Yahoo2026-10-26T09:00:00.000Z
  18. Yahoo2026-10-26T05:06:25.000Z
  19. Yahoo2026-10-26T05:06:06.000Z
  20. Yahoo2026-10-25T16:01:03.000Z
  21. Yahoo2026-10-26T07:59:00.000Z
  22. Yahoo2026-10-26T07:33:21.000Z
  23. Yahoo2026-10-26T06:00:58.000Z
  24. Yahoo2026-10-26T09:20:02.000Z
  25. Yahoo2026-10-26T07:21:07.000Z
  26. Yahoo2026-10-26T03:37:02.000Z
  27. Yahoo2026-10-26T07:20:00.000Z
  28. Yahoo2026-10-25T15:17:00.000Z
GC / MGCGold / Micro GoldWeekly thesis · STRESSED

The Lines in the Sand

4,009.5Last week's close, the floor under the whole rebound
4,036.2Week's high; an hourly close above it wakes continuation
3,991.1Flush low where late bears got caught leaning

The Trap

The flush to 3991.10 shook out longs and lured late shorts just above last week's 3989 low, then price ripped back over 4009.50 and left those shorts offside. The other trap is treating this bounce as a new uptrend while price still sits far under the daily average at 4180.79.

Last price4,029
ADR · 30 sessions79.34 pts
Daily EMA214,180.79BELOW
Reopen gapUP · 2.6 ptsFilled
3,9754,0004,0254,0504,0754,1004,1254,1504,1754,2004,225Mon 8:20close 13:30Tue 8:20close 13:30Wed 8:20close 13:30Thu 8:20close 13:30Fri 8:20close 13:30Prior week high · 4,211.2Prior week low · 3,989H1 · EMA21 · GC / MGC 4,029Dashed: last night's path
Overnight: invalidated

The Read

INVALIDATED

Bears ran gold from 4185.1 to 4009.5 on the week, smashing through the prior-week 4094.8 low and closing near the bottom of the range. Friday's liquidation tagged 3989, and the bounce off it barely dented the decline. The counter-argument has teeth: ETF and central-bank demand still underpin the longer picture, and Friday's lighter volume means the flush lacked full participation. Still, the evidence plainly sides with the bears. Hold under 4049.9 and the pressure stays on; break 3989 on a close and the floor is gone.

Morning review · Oct 26, 7:30 AM EDT

Bears ran gold down to 3991.10, just shy of last week's 3989 low, and bulls slammed it right back over 4009.50 to 4029, above the hourly average at 4024.15. For now the evidence sides with the bounce, but it's a bounce inside a downtrend, with the daily average way up at 4180.79 and higher yields or a firmer dollar able to snuff it out before the Fed. Hold 4009.50 and the door stays open toward 4049.90 and the 4060 area, with an hourly close over 4036.20 as the tell; lose 4009.50 on an hourly close and the rebound is dead.

Overnight evidence · 9 cited findings

Overnight price action

  • MGC traded from a 3991.1 overnight low to a 4036.2 high and was at 4029 at the observation cutoff.
  • Net change from the prior-evening baseline was +16.9 points across a 45.1-point range.
  • The opening gap to the 4009.5 prior close filled before price recovered above that level.
  • Price finished the latest completed H1 bar above the 4024.15 hourly EMA21, but the bar remained below the 23.9-point expansion threshold.

Overnight events

  • Gold reporting cited easing yields as support while emphasizing the pending FOMC decision: https://www.fxstreet.com/news/gold-rebounds-from-three-month-low-and-retakes-4-000-on-weak-usd-focus-remains-on-fomc-202610260434

What changed

  • Price action changed from the prior bearish read to bullish.
  • The 3991.1 rejection, reclaimed weekly open and recovery above the hourly EMA21 invalidate the prior continuation path.
  • Compression and the deeply negative daily trend prevent high conviction.
  • Structural ETF demand supports the rebound, while yield and dollar risk remain the principal opposition.
Yesterday's daily candle · Fri, Oct 23
Open4,042.7High4,049.9Low3,989Close4,009.5
bearish · range 60.9 pts
Projected range · next session70 pts3,972 – 4,042
Evidence · 8 cited findings

Price action · weekly / daily / H1

  • Weekly structure is decisively bearish: MGC fell from 4185.1 to 4009.5, took and accepted below the prior-week 4094.8 low and closed near the bottom of its 222.2-point range.
  • Daily price rejected the 4180.79 EMA21 and closed 2.159 ADR below it; Friday's bearish candle retained most of the decline after reaching 3989.
  • H1 remained below a sharply falling 4029.50 EMA21 and compressed near 4009.5 after the 10:00 liquidation. A close below 3989 supports continuation, while sustained trade above 4049.9 signals a larger correction.

Metrics

  • Friday used 76.8% of the 79.34-point ADR and closed 171.29 points below the daily EMA21.
  • The final H1 range was 8.6 points versus a 23.9-point expansion threshold, so expansion was not active at the close.
  • Friday volume was 0.918 times the 30-session average, limiting confirmation from participation.

Sentiment & current events

  • The FOMC meets October 27-28, with the decision and press conference scheduled for October 28: https://www.federalreserve.gov/newsevents/2026-october.htm
  • Cross-asset liquidation raises downside risk, but structural demand may establish a floor rather than predict the next session.
Sources & evidence dates · 8
  1. federalreserve.gov2025-06-24
  2. bea.gov2026-06-15
  3. bea.gov2026-09-30
  4. home.treasury.gov2026-10-23
  5. federalreserve.gov2026-10-07
  6. federalreserve.gov2026-10-07
  7. The WSB aggregator's fear scores and anecdotes lack an inspectable sample and methodology. Under the stated evidence rules, they cannot provide directional evidence for any symbol.2026-10-25T17:12:00-04:00
CL / MCLWTI Crude Oil / Micro WTI Crude OilWeekly thesis · STRESSED

The Lines in the Sand

101.72Get back above it and the pullback loses its grip
100.57Overnight low; an hourly close under it opens 99.80-100.00
103.43Last week's close, an unfilled gap hanging overhead

The Trap

After last week's big run, dip chasers keep treating every tick lower as a gift while hourly bars print lower highs and lower lows from 103.93. The mirror trap is pressing the drop too hard against falling inventories, OPEC restraint and live Iran headlines, where one headline can rip it back.

Last price100.9
ADR · 30 sessions3.69 pts
Daily EMA2194.39ABOVE
Reopen gapDOWN · -0.88 ptsOpen · 0.238 ADR
9596979899100101102103104105Mon 9:00close 14:30Tue 9:00close 14:30Wed 9:00close 14:30Thu 9:00close 14:30Fri 9:00close 14:30Gap fill · 103.43Prior week high · 103.93Prior week low · 95.26H1 · EMA21 · CL / MCL 100.9Dashed: last night's path
Overnight: invalidated

The Read

INVALIDATED

Bulls punched through last week's 99.35 high and closed at 103.43, just under the 103.93 weekly high, on volume more than four times normal. Bears are offside for now, but Friday's run blew well past its typical daily range, which raises the odds of a pullback. The premium also hangs on headlines: no Atlantic storm is active, and easing geopolitical tension or rising U.S. output could drain it fast. The tilt favors the bulls, but not by a mile. Hold above 102.05 and the door to 103.93 stays open; lose 102.05 on an hourly close and the breakout is retracing, with 99.35 the last floor.

Morning review · Oct 26, 7:30 AM EDT

Profit-takers have the wheel after last week's surge: the week opened at 102.55, below the 103.43 prior close, and slid from 102.68 to 100.90 on heavy volume. Price sits under the hourly average at 101.38 with the 103.43 gap still overhead, while hopes of U.S.-Iran de-escalation and overbought conditions add weight. The counter-case is solid: falling inventories and OPEC restraint keep the bigger trend intact above the daily average at 94.39. An hourly close under 100.57 opens 99.80-100.00; get back above 101.72 and the pullback loses its grip.

Overnight evidence · 9 cited findings

Overnight price action

  • MCL traded from a 102.68 overnight high to a 100.57 low and was at 100.9 at the observation cutoff.
  • Net change from the prior-evening baseline was -1.65 points across a 2.11-point range.
  • The latest completed H1 bar closed below the 101.38 hourly EMA21 but did not exceed the 0.82-point expansion threshold.

Overnight events

  • Current reporting attributed oil weakness to de-escalation hopes and correction of overbought conditions: https://finance.yahoo.com/energy/articles/oil-prices-down-almost-1-232445179.html
  • No scheduled EIA release occurred overnight; the next weekly report is October 28: https://www.eia.gov/petroleum/supply/weekly/schedule.php

What changed

  • Price action changed from the prior bullish read to bearish.
  • The 1.65-point decline, lower hourly structure and price below the hourly EMA21 invalidate the prior continuation path.
  • Elevated volume and the bearish daily body support the retracement, but inactive hourly expansion limits conviction.
  • Tight inventories, OPEC restraint and geopolitical risk materially oppose the bearish read.
Yesterday's daily candle · Fri, Oct 23
Open99.09High103.93Low98.83Close103.43
bullish · range 5.1 pts
Projected range · next session2.2 pts102.65 – 104.85
Evidence · 9 cited findings

Price action · weekly / daily / H1

  • Weekly structure is bullish: MCL broke and accepted above the prior-week 99.35 high and closed at 103.43 near the 103.93 weekly high after an 8.67-point range.
  • Friday delivered a 4.34-point bullish body on 4.551 times average volume and closed 2.448 ADR above the 94.39 EMA21, confirming momentum while showing substantial extension.
  • H1 maintained higher highs and higher lows and closed above its rising 101.73 EMA21. A close above 103.93 supports expansion, while an H1 close below 102.05 warns that the breakout is retracing.

Metrics

  • Friday used 138.1% of the 3.69-point ADR, confirming expansion but increasing short-term mean-reversion risk.
  • The final H1 range was 0.60 versus a 0.82 expansion threshold, so fresh hourly expansion was not active at the close.
  • Friday volume was 4.551 times the 30-session average, strongly supporting the breakout.

Sentiment & current events

  • The next EIA Weekly Petroleum Status Report is scheduled for October 28; no primary-source inventory consensus was verified: https://www.eia.gov/petroleum/supply/weekly/schedule.php
  • NOAA/NHC reported no active Atlantic tropical cyclones at 2:00 p.m. ET on October 25, removing immediate storm support for Gulf infrastructure risk: https://www.nhc.noaa.gov/cyclones/?textnofollow_blank
  • Refinery recovery, rising U.S. production, floating inventories and easing geopolitical tension could reverse the headline-sensitive premium.
Sources & evidence dates · 11
  1. federalreserve.gov2025-06-24
  2. bea.gov2026-06-15
  3. bea.gov2026-09-30
  4. eia.gov2026-10-21
  5. eia.gov2025-12-29
  6. nhc.noaa.gov2026-10-25T14:00:00-04:00
  7. federalreserve.gov2026-10-07
  8. federalreserve.gov2026-10-07
  9. reddit.com2026-10-24T00:00:00-04:00
  10. The WSB aggregator's fear scores and anecdotes lack an inspectable sample and methodology. Under the stated evidence rules, they cannot provide directional evidence for any symbol.2026-10-25T17:12:00-04:00

Free. Always. Futures trading edge in your inbox.

You're in. Watch your inbox.

We do not send junk mail. We do not spam.