Session Prep

Two minutes tonight. A plan tomorrow.
Evening edition · Data as of Thu, Oct 22, 5:00 PM EDT · All times Eastern
Deep research

Tonight's one thing

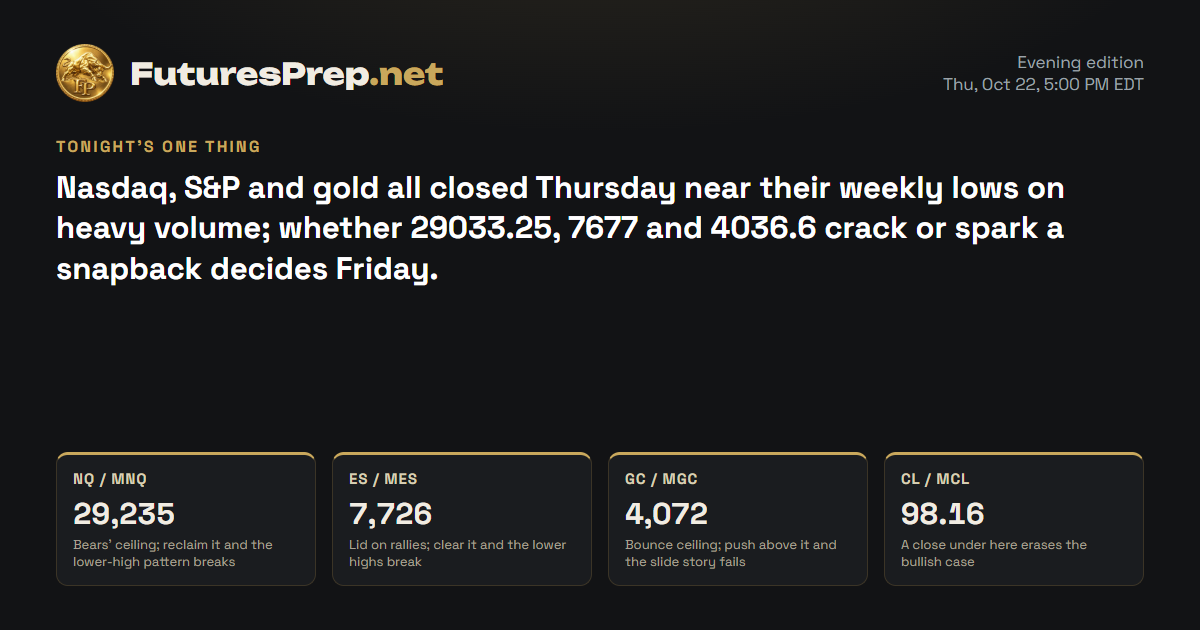
Nasdaq, S&P and gold all closed Thursday near their weekly lows on heavy volume; whether 29033.25, 7677 and 4036.6 crack or spark a snapback decides Friday.

Tomorrow's market movers · Friday, October 23

Time ETImpactEventForecastPrevious
9:45 AMMediumFlash Manufacturing PMI55.457.0
9:45 AMMediumFlash Services PMI57.958.7
10:00 AMMediumRevised UoM Consumer Sentiment46.346.3
10:00 AMMediumRevised UoM Inflation Expectations—4.7%

U.S. releases, high and medium impact.

NQ / MNQE-mini / Micro E-mini Nasdaq-100Weekly thesis · FULFILLED

The Lines in the Sand

29,235Bears' ceiling; reclaim it and the lower-high pattern breaks
29,268.75Old prior-week floor, broken and now acting as a lid
29,033.25The week's low; the last floor before fresh air

The Trap

After a drop this large, late shorts tend to pile in right at the 29033.25 low, just as the rubber band is stretched furthest. A sharp snap back toward 29229.75 is the kind of move that shakes them loose.

Last price29,092.25
ADR · 30 sessions517.03 pts
Daily EMA2130,243.89REJECT
Reopen gapNo opening gap
29,00029,20029,40029,60029,80030,00030,200close 16:00Fri 9:30close 16:00Mon 9:30close 16:00Tue 9:30close 16:00Wed 9:30close 16:00Thu 9:30close 16:00Prior week low · 29,268.75H1 · EMA21 · NQ / MNQ 29,092.25Yellow: 09:30 open · dashed gray: 16:00 close (ET)

The Read

Bears ran the Nasdaq off 29996 and never let go, closing at 29092.25 on a heavy-volume day. The prior-week low at 29268.75 broke and price stayed under it, leaving anyone defending that floor offside. The counter-argument is real: price is stretched far below its 30243.89 daily average, and stretched tapes can snap back hard. Still, the weight of the evidence sits with the bears while price stays capped under 29235. Reclaim 29235 and the lower-high pattern is broken; lose 29033.25 and the week's floor is gone.

Yesterday's daily candle · Thu, Oct 22
Open29,983.75High29,996Low29,033.25Close29,092.25
bearish · range 962.75 pts
Projected range · next session475 pts28,760 – 29,235

Index drivers

Most Nasdaq heavyweights finished Thursday in the red: NVIDIA, Amazon, Meta, Broadcom, Alphabet, Microsoft and Tesla all fell, with Meta taking the deepest hit. Apple was the lone green name among the leaders. Amazon reports earnings October 29 after the close, and Apple follows on November 2 after the close.

Market data as of Oct 22, 6:33 PM EDT · Weights as of 2026-09-30

Evidence · 8 cited findings

Price action · weekly / daily / H1

  • The week accepted below the 29268.75 prior-week low and closed Thursday at 29092.25 after failing far below the 30114 weekly high; sustained recovery above the 29229.75 weekly open is required to improve the red-close structure.
  • Thursday produced a 962.75-point bearish range, equal to 1.86 ADR, with a 0.926 body and a close below the 30243.89 daily EMA21.
  • H1 retained lower highs and lows below a falling EMA21; the final 139-point expansion bar closed at 29092.25, favoring a test through 29033.25 after any limited rebound, although the extended decline raises snapback risk.

Metrics

  • Thursday volume was 1.57 times its 30-session average, supporting the unusually large bearish body and indicating broad participation.
  • The close was 2.23 ADR below the daily EMA21, which supports downside momentum but also identifies substantial short-term extension.

Sentiment & current events

  • Index-driver breadth supports the bearish tape: NVDA fell 4.40%, AMZN 4.57%, META 6.98%, AVGO 4.31%, GOOGL 3.15% and TSLA 3.08%, while AAPL gained 1.23%; weights source: https://www.invesco.com/qqq-etf/en/about.html
  • French 10-year yields reached approximately 5.11% amid sovereign-market stress, but the directional effect on U.S. equities is scenario-dependent: https://www.reuters.com/world/europe/french-debt-risk-premium-reaches-euro-zone-sovereign-crisis-levels-2026-10-22
  • CFTC positions are dated October 13 and cannot verify current post-selloff positioning: https://www.cftc.gov/MarketReports/CommitmentsofTraders/index.htm
Sources & evidence dates · 26
  1. The FOMC meeting is scheduled for October 27-28, 2026, with the policy release at 2:00 p.m. ET and press conference at 2:30 p.m. ET on October 28.2026-10-07
  2. bls.gov2026-10-14
  3. treasurydirect.gov2026-10-22
  4. reuters.com2026-10-22
  5. cftc.gov2026-10-16
  6. Yahoo2026-10-22T21:53:28.000Z
  7. Yahoo2026-10-22T21:51:12.000Z
  8. Yahoo2026-10-22T21:50:00.000Z
  9. Yahoo2026-10-22T20:45:03.000Z
  10. Yahoo2026-10-22T20:26:24.000Z
  11. Yahoo2026-10-22T20:14:07.000Z
  12. Yahoo2026-10-22T21:53:23.000Z
  13. Yahoo2026-10-22T20:44:00.000Z
  14. Yahoo2026-10-22T20:34:18.000Z
  15. Yahoo2026-10-22T20:45:02.000Z
  16. Yahoo2026-10-22T20:41:00.000Z
  17. Yahoo2026-10-22T21:15:12.000Z
  18. Yahoo2026-10-22T21:13:13.000Z
  19. Yahoo2026-10-22T20:45:02.000Z
  20. Yahoo2026-10-22T20:38:05.000Z
  21. Yahoo2026-10-22T19:50:00.000Z
  22. Yahoo2026-10-22T20:39:53.000Z
  23. Yahoo2026-10-22T21:10:54.000Z
  24. Yahoo2026-10-22T20:33:03.000Z
  25. Yahoo2026-10-22T20:27:32.000Z
ES / MESE-mini / Micro E-mini S&P 500Weekly thesis · STRESSED

The Lines in the Sand

7,726Lid on rallies; clear it and the lower highs break
7,676Prior-week low, still unbroken, holding the whole week up
7,778.18Daily average lost Thursday; bulls' first real repair point

The Trap

The pile-up sits around 7677 and 7676, where breakdown chasers lean on the floor before it actually gives way. The tell is whether the prior-week low breaks and stays broken, or just gets poked and reclaimed.

Last price7,703.75
ADR · 30 sessions81.11 pts
Daily EMA217,778.18LOSS
Reopen gapNo opening gap
7,6807,7007,7207,7407,7607,7807,8007,820close 16:00Fri 9:30close 16:00Mon 9:30close 16:00Tue 9:30close 16:00Wed 9:30close 16:00Thu 9:30close 16:00Prior week low · 7,676H1 · EMA21 · ES / MES 7,703.75Yellow: 09:30 open · dashed gray: 16:00 close (ET)

The Read

Bears knocked the S&P off its 7778.18 daily average and drove it down to 7677 before a late pause. Volume came in heavy, but the last hourly push ran out of steam, and the week is still clinging to a green candle above its 7679 open. That thin thread is the bulls' best argument, along with the 7676 prior-week low that has not broken yet. Even so, the evidence leans clearly lower while 7726 caps any bounce. Clear 7726 and the lower-high pattern breaks; lose 7676 and the floor under the whole week is gone.

Yesterday's daily candle · Thu, Oct 22
Open7,797High7,798.75Low7,677Close7,703.75
bearish · range 121.75 pts
Projected range · next session58 pts7,668 – 7,726

Index drivers

The S&P's biggest names mostly fell Thursday, with AMD, Meta and Micron taking the hardest hits and NVIDIA, Amazon, Broadcom, Alphabet, Microsoft and Tesla also lower. Apple and Berkshire Hathaway closed higher, proof the damage was not universal. Amazon reports October 29, Apple November 2 and AMD November 3, all after the close.

Market data as of Oct 22, 6:33 PM EDT · Weights as of 2026-10-01

Evidence · 8 cited findings

Price action · weekly / daily / H1

  • Thursday lost the 7778.18 daily EMA21 on a 1.50-ADR bearish candle with a 0.766 body, closing at 7703.75 after reaching 7677.
  • H1 preserved a lower-high/lower-low sequence below the 7722.80 EMA21, but the final 15.25-point bar was below the 18.5-point expansion threshold after the rejection from 7677.
  • The week remained marginally above its 7679 open and had not taken the 7676 prior-week low, preserving a narrow GREEN weekly-close possibility despite the bearish session forecast.

Metrics

  • Thursday volume was 1.52 times its 30-session average, supporting the daily distribution signal.
  • The close was 0.92 ADR below the daily EMA21, bearish but less extended than MNQ or MGC.

Sentiment & current events

  • Broad index drivers were weak: NVDA fell 4.40%, MSFT 2.23%, AMZN 4.57%, META 6.98%, AVGO 4.31%, GOOGL 3.15%, MU 6.26% and AMD 8.10%; weights source: https://www.ssga.com/us/en/intermediary/etfs/state-street-spdr-sp-500-etf-trust-spy
  • AAPL gained 1.23% and Berkshire Hathaway gained 1.48%, providing visible breadth contradictions to the risk-off signal.
  • French sovereign stress is verified, but its precise effect on U.S. equity futures is uncertain: https://www.reuters.com/world/europe/french-debt-risk-premium-reaches-euro-zone-sovereign-crisis-levels-2026-10-22
Sources & evidence dates · 33
  1. The FOMC meeting is scheduled for October 27-28, 2026, with the policy release at 2:00 p.m. ET and press conference at 2:30 p.m. ET on October 28.2026-10-07
  2. bls.gov2026-10-14
  3. treasurydirect.gov2026-10-22
  4. reuters.com2026-10-22
  5. cftc.gov2026-10-16
  6. Yahoo2026-10-22T21:53:28.000Z
  7. Yahoo2026-10-22T21:51:12.000Z
  8. Yahoo2026-10-22T21:50:00.000Z
  9. Yahoo2026-10-22T20:45:03.000Z
  10. Yahoo2026-10-22T20:26:24.000Z
  11. Yahoo2026-10-22T20:14:07.000Z
  12. Yahoo2026-10-22T21:53:23.000Z
  13. Yahoo2026-10-22T20:44:00.000Z
  14. Yahoo2026-10-22T20:34:18.000Z
  15. Yahoo2026-10-22T20:45:02.000Z
  16. Yahoo2026-10-22T20:41:00.000Z
  17. Yahoo2026-10-22T21:15:12.000Z
  18. Yahoo2026-10-22T21:13:13.000Z
  19. Yahoo2026-10-22T20:45:02.000Z
  20. Yahoo2026-10-22T20:38:05.000Z
  21. Yahoo2026-10-22T19:50:00.000Z
  22. Yahoo2026-10-22T20:39:53.000Z
  23. Yahoo2026-10-22T21:10:54.000Z
  24. Yahoo2026-10-22T20:33:03.000Z
  25. Yahoo2026-10-22T20:27:32.000Z
  26. Yahoo2026-10-22T20:45:03.000Z
  27. Yahoo2026-10-22T20:26:00.000Z
  28. Yahoo2026-10-22T19:51:31.000Z
  29. Yahoo2026-10-22T19:50:53.000Z
  30. Yahoo2026-10-22T18:25:00.000Z
  31. Yahoo2026-10-22T17:25:49.000Z
  32. Yahoo2026-10-22T07:19:25.000Z
GC / MGCGold / Micro GoldWeekly thesis · INVALIDATED

The Lines in the Sand

4,072Bounce ceiling; push above it and the slide story fails
4,094.8Old prior-week floor, broken and flipped into overhead resistance
4,036.6Week's low, where gold closed Thursday pinned

The Trap

Bears often get greedy pressing a market pinned at its low, then a quick pop into the 4055-4070 zone shakes them loose. Dip-catchers face the mirror trap: a record ETF story does not halt a falling tape.

Last price4,039.9
ADR · 30 sessions81.04 pts
Daily EMA214,196.99REJECT
Reopen gapNo opening gap
4,0404,0604,0804,1004,1204,1404,1604,1804,2004,220close 13:30Fri 8:20close 13:30Mon 8:20close 13:30Tue 8:20close 13:30Wed 8:20close 13:30Thu 8:20close 13:30Prior week low · 4,094.8H1 · EMA21 · GC / MGC 4,039.9Yellow: 08:20 open · dashed gray: 13:30 close (ET)

The Read

Gold bulls got run over Thursday: price fell from 4164.9 to 4036.6 and closed at 4039.9, right on the week's low. The prior-week low at 4094.8 gave way and price stayed below it, turning old support into a ceiling. The counter-argument: global gold ETF holdings sit at a record, and price is stretched far under its 4196.99 daily average, which is fuel for a snapback. The evidence clearly sides with the bears while 4072 holds as a lid. Push back above 4072 and the shallow-bounce picture fails; break 4036.6 and the slide has room to run.

Yesterday's daily candle · Thu, Oct 22
Open4,159High4,164.9Low4,036.6Close4,039.9
bearish · range 128.3 pts
Projected range · next session84 pts3,988 – 4,072
Evidence · 8 cited findings

Price action · weekly / daily / H1

  • Weekly price accepted below the 4094.8 prior-week low and stood near the 4036.6 weekly extreme, leaving a large bearish weekly body into the final session.
  • Thursday produced a 128.3-point, 1.58-ADR bearish range with a 0.928 body and closed at 4039.9, 1.94 ADR below the 4196.99 daily EMA21 after rejection.
  • H1 retained persistent lower highs and closes below a falling EMA21; seven bars since expansion and proximity to the low allow a shallow 4055-4070 consolidation before another test below 4036.6.

Metrics

  • Thursday volume was 1.13 times its 30-session average, confirming participation without the extreme volume multiple seen in the equity contracts.
  • The 1.94-ADR distance below the daily EMA21 confirms strong downside momentum while increasing rebound risk.

Sentiment & current events

  • World Gold Council data show record global gold ETF holdings of 4256 tonnes after September inflows of 67 tonnes, a structural support that has not prevented short-horizon weakness: https://www.gold.org/goldhub/data/global-gold-backed-etf-holdings-and-flows
  • The World Gold Council reported an 8.5% September gold decline alongside higher Treasury yields, dollar strength and contracting COMEX positioning: https://www.gold.org/goldhub/research/gold-market-commentary-september-2026
  • French sovereign stress could create haven demand, but higher sovereign yields can simultaneously pressure gold: https://www.reuters.com/world/europe/french-debt-risk-premium-reaches-euro-zone-sovereign-crisis-levels-2026-10-22
Sources & evidence dates · 9
  1. The FOMC meeting is scheduled for October 27-28, 2026, with the policy release at 2:00 p.m. ET and press conference at 2:30 p.m. ET on October 28.2026-10-07
  2. bls.gov2026-10-14
  3. treasurydirect.gov2026-10-22
  4. Global physically backed gold ETFs received US$10 billion and 67 tonnes in September, taking holdings to a record 4,256 tonnes; Q3 inflows reached US$31 billion.2026-10-07
  5. gold.org2026-10-07
  6. reuters.com2026-10-22
  7. cftc.gov2026-10-16
  8. gold.org2026-10-07
CL / MCLWTI Crude Oil / Micro WTI Crude OilWeekly thesis · FULFILLED

The Lines in the Sand

98.16A close under here erases the bullish case
99.35Prior-week high the bulls broke but could not hold
100.18Thursday's high; next test if the shelf holds

The Trap

Breakout chasers got caught above 99.35 when the run to 101.37 could not stick. Fading every pop is the mirror mistake when volume is this heavy and inventories keep tightening.

Last price99.09
ADR · 30 sessions3.68 pts
Daily EMA2193.52HOLD
Reopen gapNo opening gap
949596979899100101102close 14:30Fri 9:00close 14:30Mon 9:00close 14:30Tue 9:00close 14:30Wed 9:00close 14:30Thu 9:00close 14:30Prior week high · 99.35H1 · EMA21 · CL / MCL 99.09Yellow: 09:00 open · dashed gray: 14:30 close (ET)

The Read

Crude whipsawed between 95.26 and 101.37 this week and finished Thursday at 99.09, almost exactly where the week opened at 99.07. Volume exploded on the bullish daily candle, but the push above the 99.35 prior-week high failed to hold, and hourly momentum faded into the close. The counter-argument is heavy: the IEA sees demand shrinking while supply climbs, even as inventories tighten. That adds up to only a slight tilt higher, not a conviction move. Hold the 98.94-99.00 shelf and the door to 100.18 stays open; a close below 98.16 erases the bullish case.

Yesterday's daily candle · Thu, Oct 22
Open97.8High100.18Low97.72Close99.09
bullish · range 2.46 pts
Projected range · next session2.5 pts98.55 – 101.05
Evidence · 8 cited findings

Price action · weekly / daily / H1

  • Thursday produced a bullish 0.67-ADR candle, held 1.51 ADR above the 93.52 daily EMA21 and closed at 99.09 after trading to 100.18.
  • H1 recovered from 97.72 and closed marginally above its 99.04 EMA21, but momentum contracted over the final three bars.
  • Holding the 98.94-99.00 area favors another test of 100.18, while a close below 98.16 would negate the bullish scenario.

Metrics

  • Thursday volume was 4.43 times its 30-session average, strongly supporting participation in the bullish daily candle.
  • The weekly close was effectively flat against the 99.07 open, and price failed to accept above the 99.35 prior-week high after reaching 101.37, limiting conviction.

Sentiment & current events

  • The IEA forecasts world oil demand falling 2.5 mb/d year over year in Q4 2026 and 2.6 mb/d on average in 2026, while September supply increased 2.5 mb/d to 102.3 mb/d: https://www.iea.org/reports/oil-market-report-october-2026
  • The same IEA report cites falling inventories, steep backwardation, constrained refined-product availability and fragile Middle East supply recovery, preventing a simple bearish fundamental conclusion: https://www.iea.org/reports/oil-market-report-october-2026
  • EIA's October 21 summary was consistent with near-term tightening, but its complete numerical bundle was not independently extracted during research: https://ir.eia.gov/wpsr/summary.txt
Sources & evidence dates · 7
  1. bls.gov2026-10-14
  2. EIA's week-ended October 16 petroleum report supports a near-term tightening interpretation, including the reported crude and gasoline draws, but the exact entire numerical bundle was not independently extracted from the primary report during this check.2026-10-21
  3. The IEA forecasts world oil demand falling 2.5 mb/d year over year in Q4 2026 and 2.6 mb/d on average in 2026; September supply increased 2.5 mb/d month over month to 102.3 mb/d, including a 2.1 mb/d OPEC+ increase.2026-10-14
  4. The IEA simultaneously reports falling inventories, steep backwardation, restricted refined-product availability and fragile Middle East supply recovery. These conditions contradict treating its weak-demand forecast as unambiguously bearish for near-term MCL.2026-10-14
  5. cftc.gov2026-10-16
  6. iea.org2026-10-14

Free. Always. Futures trading edge in your inbox.

You're in. Watch your inbox.

We do not send junk mail. We do not spam.