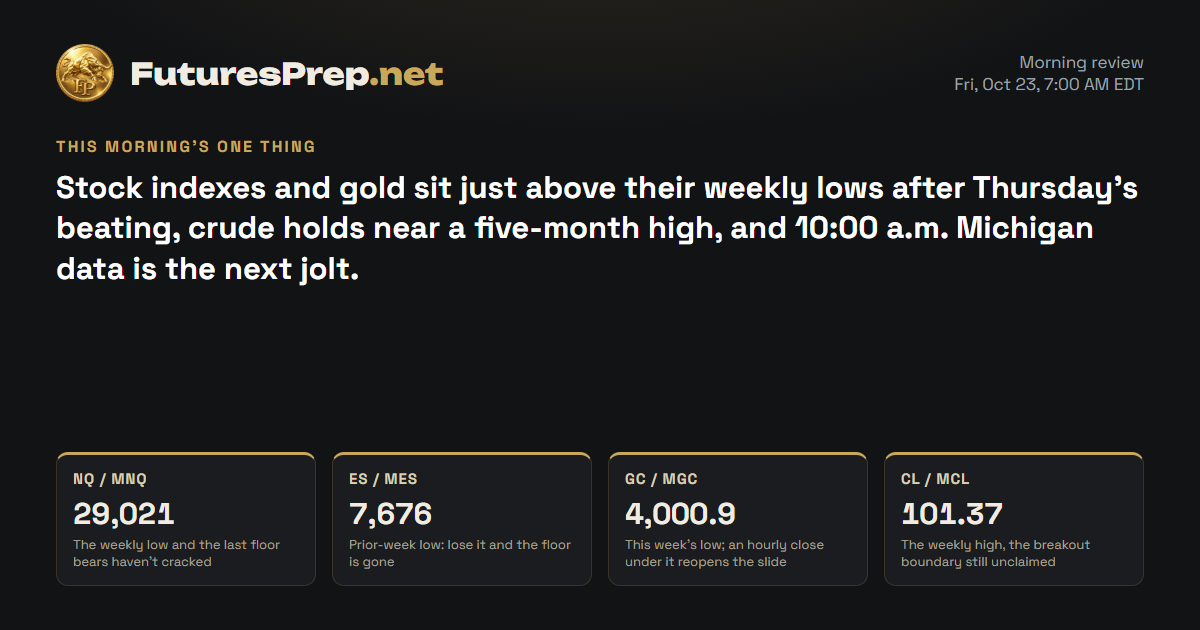
The Lines in the Sand
The Trap
After a slide this long, late bears tend to pile in right at 29021 and get squeezed when that floor holds and price snaps back. Bulls who read a quiet Friday as the bottom get caught below a falling hourly average.
The Read
Bears ran the Nasdaq off 29996 and never let go, closing at 29092.25 on a heavy-volume day. The prior-week low at 29268.75 broke and price stayed under it, leaving anyone defending that floor offside. The counter-argument is real: price is stretched far below its 30243.89 daily average, and stretched tapes can snap back hard. Still, the weight of the evidence sits with the bears while price stays capped under 29235. Reclaim 29235 and the lower-high pattern is broken; lose 29033.25 and the week's floor is gone.
Morning review · Oct 23, 7:30 AM EDT
Bears own the week: Thursday's heavy, high-volume drop pushed price under the 29268.75 prior-week low and kept it there. Friday has been a stalemate so far, with a narrow, thin-volume range and price at 29098.25, just above the 29021 low. The evidence clearly leans lower, but the counter-case is real: if 29021 holds after a drop this big, a sharp relief bounce can come without changing the bigger picture. An hourly close below 29021 opens the trapdoor toward 28850; reclaiming 29278.75 and holding above 29345 would leave the bears offside.
Overnight evidence · 11 cited findings
Overnight price action
- From the evening baseline, MNQ traded between 29021 and 29278.75 and changed only about 6 points versus Thursday's 29092.25 close.
- The prior projected path called for 29020 at 02:00 and 28880 at 06:00; observed completed-bar closes were 29183.50 and 29098.25, so the anticipated overnight continuation did not occur.
- Price remained below the H1 EMA21 and finished the 06:00 bar at 29098.25 after rejecting the 29212-29230 area.
- The 20.75-point opening gap to 29092.25 filled overnight.
Overnight events
- No FOMC decision or Treasury auction was scheduled during the overnight or coming cash-session window.
- CME's corroborating snapshot placed the overnight low at 29022.75, immediately above but not through the 29021 expansion trigger: https://www.cmegroup.com/markets/equities/nasdaq/e-mini-nasdaq-100.quotes.html
- Actual University of Michigan data, current dealer positioning, DXY and authoritative synchronized Treasury-yield data were unavailable at the cutoff.
What changed
- Bearish weekly, daily and H1 structure preserves the evening direction.
- Technology-driver breadth and Thursday's volume support confidence.
- Failure to follow the prior overnight downside path requires an adjusted verdict and a conditional continuation trigger.
- Extension and the unbroken 29021 low cap conviction below the evening level.
Index drivers
| Ticker | Approx. weight | Day move | Next earnings | Top headline |
|---|---|---|---|---|
| NVDA | 8.4% | −4.4% | — | Apple could be about to dethrone Nvidia as world's most valuable company |
| MSFT | 5.75% | −2.23% | — | AI stock bears probably just missed this point on Tesla in their run for the exits |
| AAPL | 7.28% | +1.23% | Nov 2 · After close | Warren Buffett's Successor, Greg Abel, Has 32% of Berkshire Hathaway's $364 Billion Portfolio Invested in 3 Unstoppable AI Stocks |
| AMZN | 4.04% | −4.57% | Oct 29 · After close | AI stock bears probably just missed this point on Tesla in their run for the exits |
| META | 3.26% | −6.98% | — | SpaceX may not follow Meta's bold plan to raise money for AI |
| AVGO | 2.47% | −4.31% | — | What Would It Take For Qualcomm Stock To Move Higher? |
| GOOGL | 3% | −3.15% | — | Alphabet (NASDAQ:GOOGL) Screens as a GARP-Friendly Quality Compounder |
| TSLA | 2.81% | −3.08% | — | Larry Fink says Americans’ retirement savings need to fund $10 trillion AI infrastructure needs. Protect your wealth |
Nvidia, Microsoft, Amazon, Meta, Broadcom, Alphabet and Tesla all closed lower Thursday, and Meta took the heaviest hit of the group. Apple was the only listed heavyweight to finish higher. Amazon reports earnings October 29 after the close, and Apple follows November 2 after the close.
Market data as of Oct 23, 7:33 AM EDT · Weights as of 2026-09-30
Evidence · 8 cited findings
Price action · weekly / daily / H1
- The week accepted below the 29268.75 prior-week low and closed Thursday at 29092.25 after failing far below the 30114 weekly high; sustained recovery above the 29229.75 weekly open is required to improve the red-close structure.
- Thursday produced a 962.75-point bearish range, equal to 1.86 ADR, with a 0.926 body and a close below the 30243.89 daily EMA21.
- H1 retained lower highs and lows below a falling EMA21; the final 139-point expansion bar closed at 29092.25, favoring a test through 29033.25 after any limited rebound, although the extended decline raises snapback risk.
Metrics
- Thursday volume was 1.57 times its 30-session average, supporting the unusually large bearish body and indicating broad participation.
- The close was 2.23 ADR below the daily EMA21, which supports downside momentum but also identifies substantial short-term extension.
Sentiment & current events
- Index-driver breadth supports the bearish tape: NVDA fell 4.40%, AMZN 4.57%, META 6.98%, AVGO 4.31%, GOOGL 3.15% and TSLA 3.08%, while AAPL gained 1.23%; weights source: https://www.invesco.com/qqq-etf/en/about.html
- French 10-year yields reached approximately 5.11% amid sovereign-market stress, but the directional effect on U.S. equities is scenario-dependent: https://www.reuters.com/world/europe/french-debt-risk-premium-reaches-euro-zone-sovereign-crisis-levels-2026-10-22
- CFTC positions are dated October 13 and cannot verify current post-selloff positioning: https://www.cftc.gov/MarketReports/CommitmentsofTraders/index.htm
Sources & evidence dates · 24
- The FOMC meeting is scheduled for October 27-28, 2026, with the policy release at 2:00 p.m. ET and press conference at 2:30 p.m. ET on October 28.2026-10-07
- bls.gov2026-10-14
- treasurydirect.gov2026-10-22
- reuters.com2026-10-22
- cftc.gov2026-10-16
- Yahoo2026-10-23T10:38:26.000Z
- Yahoo2026-10-23T10:24:00.000Z
- Yahoo2026-10-23T10:20:02.000Z
- Yahoo2026-10-23T09:51:01.000Z
- Yahoo2026-10-23T09:01:56.000Z
- Yahoo2026-10-23T09:01:53.000Z
- Yahoo2026-10-23T09:26:01.000Z
- Yahoo2026-10-23T08:02:41.000Z
- Yahoo2026-10-23T09:42:24.000Z
- Yahoo2026-10-23T09:30:00.000Z
- Yahoo2026-10-23T08:52:36.000Z
- Yahoo2026-10-23T09:02:00.000Z
- Yahoo2026-10-23T01:29:37.000Z
- Yahoo2026-10-23T01:10:39.000Z
- ChartMill2026-10-23T11:00:58.000Z
- Yahoo2026-10-23T10:45:00.000Z
- Yahoo2026-10-23T10:39:27.000Z
- Yahoo2026-10-23T10:32:49.000Z