Session Prep

Two minutes tonight. A plan tomorrow.
Morning review · Data as of Thu, Oct 22, 7:00 AM EDT · All times Eastern
Deep research

This morning's one thing

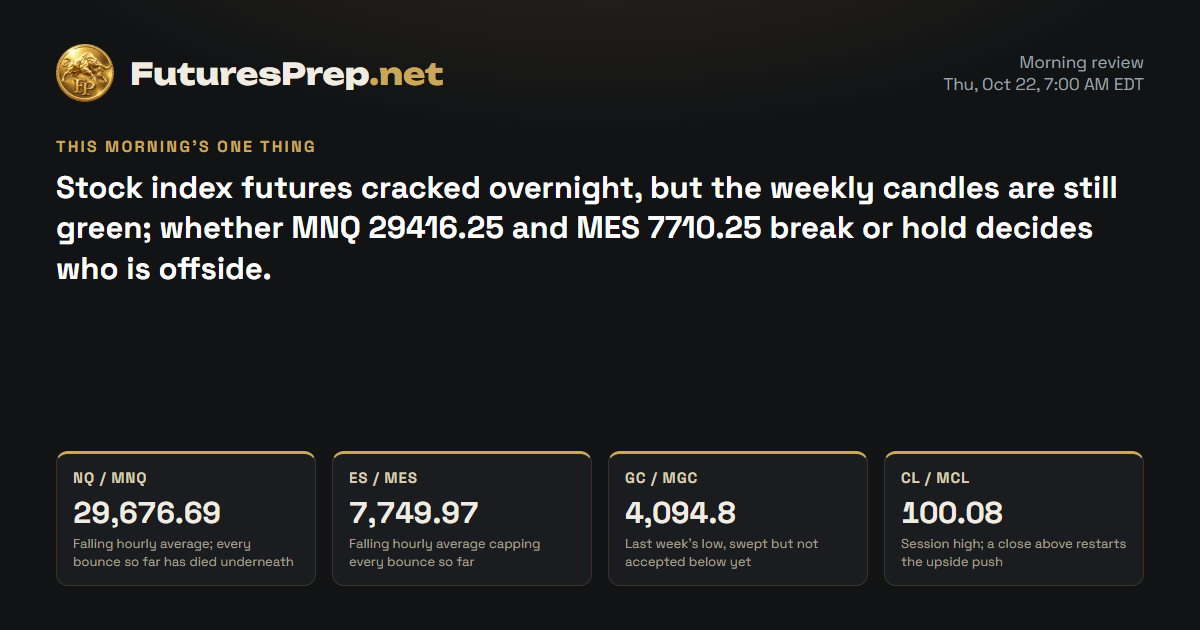
Stock index futures cracked overnight, but the weekly candles are still green; whether MNQ 29416.25 and MES 7710.25 break or hold decides who is offside.

Today's market movers · Thursday, October 22

Time ETImpactEventForecastPrevious
8:30 AMMediumUnemployment Claims200K199K

U.S. releases, high and medium impact.

NQ / MNQE-mini / Micro E-mini Nasdaq-100Weekly thesis · STRESSED

The Lines in the Sand

29,676.69Falling hourly average; every bounce so far has died underneath it
29,416.25Overnight floor; a close under it reopens the slide
29,268.75Last week's low, swept and rejected once already

The Trap

Late shorts tend to pile in after the drop has already covered more than a full day's normal range, right above last week's swept low where the last bounce started. Dip-hunters get caught the other way, treating the early-morning rebound as a turn while price is still pinned under 29676.69.

Last price29,513.75
ADR · 30 sessions500.51 pts
Daily EMA2130,359.05BELOW
Reopen gapDOWN · -39.75 ptsOpen · 0.079 ADR
29,20029,40029,60029,80030,00030,200Thu 9:30close 16:00Fri 9:30close 16:00Mon 9:30close 16:00Tue 9:30close 16:00Wed 9:30close 16:00Gap fill · 30,023.5Prior week low · 29,268.75H1 · EMA21 · NQ / MNQ 29,513.75Dashed: last night's path
Overnight: invalidated

The Read

INVALIDATED

Bears dragged the Nasdaq to 29202 this week, under last week's low of 29268.75, and could not hold it there. Bulls hauled price back to 30023.5 on heavier-than-normal volume, and the hourly chart is holding a rising average. That tilts things slightly toward the bulls, but price still sits well below the 30359.05 daily average, so this is a repair job inside a bruising stretch, not a trend. The strongest counter-argument: Tesla's after-hours direction is unresolved across sources, the overnight hours have rarely been where this market makes its big moves, and long-term averages overhead have stopped bounces like this before. Hold above 29885 and a close through 30114 opens the door to 30200 and the 30359.05 average; lose 29885 and the repair cracks.

Morning review · Oct 22, 7:30 AM EDT

Bears took the whole overnight session, dragging price from 29983.75 down to 29416.25. It now sits at 29513.75, well under the 21-day average the prior session rejected. Bulls still have the bigger picture: the week is green above its 29229.75 open, and last week's 29268.75 low was swept without sellers holding it below. The pressure leans slightly lower, but the move has already spent more than a full day's normal range before 08:30 ET jobless claims. Lose 29416.25 and the floor is gone; reclaim 29676.69 and the slide stalls, and 29996 is the door back for the bulls.

Overnight evidence · 11 cited findings

Overnight price action

  • From the prior evening baseline, MNQ traded from 29996 down to 29416.25 and was 470 points lower at 29513.75.
  • The overnight range measured 579.75 points, or 1.158 ADR, with successive H1 closes remaining below the falling EMA21.
  • The prior expected path called for 30120-30225 before a 30170 close; actual supplied bars moved in the opposite direction and ended near the overnight low.
  • A corrective bounce developed from 29416.25 to 29513.75 during 05:00-06:00, without reclaiming 29635-29677.

Overnight events

  • Meta and Tesla earnings reactions did not preserve the prior risk-on futures setup; contemporaneous reporting instead showed a sharply lower Nasdaq-100 futures opening. https://www.wsj.com/livecoverage/stock-market-today-dow-sp-500-nasdaq-10-22-2026
  • The 08:30 ET jobless-claims result was still pending; only the prior 199,000 reading was primary-source verified. https://fred.stlouisfed.org/series/ICSA
  • No timestamped primary quote was available to resolve the reported Treasury-yield direction conflict.

What changed

  • Price action reverses the prior bullish read to bearish and makes the morning verdict INVALIDATED.
  • Risk-off reporting supports, but does not create, the bearish direction.
  • Green weekly structure and rejection of the prior-week-low sweep reduce confidence in treating the move as a confirmed weekly breakdown.
  • A close below 29416.25 would activate the projected 09:00-11:00 downside expansion; recovery through 29676.69 would weaken it.
Yesterday's daily candle · Wed, Oct 21
Open29,924.5High30,114Low29,726.75Close30,023.5
bullish · range 387.25 pts
Projected range · next session410 pts29,870 – 30,280

Index drivers

In the prior regular session NVDA, AAPL, TSLA, AVGO and META closed higher, GOOGL fell, and MSFT and AMZN finished close to flat; all of those closes came before the overnight futures drop. Morning headlines centered on Meta's revenue beat and Tesla's lower annual sales goal. Amazon reports October 29 and Apple reports November 2, both after the close.

Market data as of Oct 22, 7:33 AM EDT · Weights as of 2026-09-30

Evidence · 11 cited findings

Price action · weekly / daily / H1

  • Daily closed bullish at 30023.5 (range 29726.75-30114, 0.774 ADR used). The weekly low of 29202 took the prior-week low of 29268.75 without acceptance below it, which keeps price action direction bullish.
  • The close is still 0.67 ADR below the 30359.05 daily EMA21 (event REJECT). The advance is countertrend repair until that average is reclaimed. Next resistance is 30114, then 30200.
  • H1 closed 30023.5 above its rising 29919.45 EMA21 after holding the 15:00 pullback (low 29885.75). A close below 29885 would weaken the scenario.
  • Weekly open is 29229.75 and the weekly close is 30023.5 (bullish, 2 sessions left). Prior-week high 31290 is distant resistance.

Metrics

  • The recovery candle printed 1.298x the 30-day average volume (supportive). The close sits -0.67 ADR from the daily EMA21 (opposing). Net stance is neutral.
  • ADR30 is 500.51 and 0.774 is used, leaving roughly 113 points of daily ADR budget.
  • The last H1 range was 102 against an expansion threshold of 105, so the market is not currently expanding. Top historical expansion hours are 9-13 and 15 ET, so the 21:00-00:00 ET window is outside the usual expansion hours (a contradiction).
  • Weekly thesis arithmetic (RED) requires 793.75 points against a remaining ADR budget of 1001.02. The ratio is 0.793, verdict TIGHT.

Sentiment & current events

  • Cash close 10/21: S&P 7757.17 (+0.58%), Nasdaq Composite 26702.86 (+1.05%), VIX 16.68 (-3.64%), 10-yr yield 5.15%. Volatility stress eased. https://finance.yahoo.com/quote/%5EGSPC/history/
  • Mega-cap tone: NVDA +2.54%, AAPL +1.32%, AVGO +1.03%, GOOGL -1.62% in the regular session. META +3% after hours on a Q3 revenue beat and narrowed AI capex outlook. https://finnhub.io/api/news?id=7fd9fc050818426fc2656dd07b8e72bd56c66c0618d7d1327983f1a7ef2ceed6
  • Fed: an unchanged rate is priced for the Oct 27-28 FOMC with about 15-17% hike odds and about 85% for a further hike by year-end. The blackout began 10/17. https://uk.finance.yahoo.com/news/gold-falls-near-4-110-020012559.html
Sources & evidence dates · 24
  1. S&P 500 cash index closed 10/21 at 7,757.17 (+0.58%). Dow closed 52,856.09 (+0.69%), Nasdaq Composite 26,702.86 (+1.05%), 10-yr yield 5.15%, VIX 16.68. The S&P prior close was 7,712.57, confirmed by FRED. This supports the MES bullish daily close (7,800 futures against 7,757 cash is a plausible carry premium) and the MNQ recovery.2026-10-21T16:31:21-04:00
  2. uk.finance.yahoo.com2026-10-21
  3. ir.tesla.com2026-10-21
  4. wsj.com2026-10-21T16:52:00-04:00
  5. finance.yahoo.com2026-10-21T16:31:21-04:00
  6. straits.live2026-10-21
  7. US data context for 10/20: September housing starts and permits slowed, and pending home sales fell 7.3% month on month (a record low per another report). Equities still rose, with the S&P up 0.3% and the Nasdaq about flat. Softening-economy data and lower long-end yields briefly supported bonds.2026-10-21
  8. Yahoo2026-10-22T09:39:00.000Z
  9. Yahoo2026-10-22T09:26:48.000Z
  10. Yahoo2026-10-22T09:26:01.000Z
  11. Yahoo2026-10-22T09:19:00.000Z
  12. Yahoo2026-10-22T08:17:52.000Z
  13. Yahoo2026-10-22T08:15:02.000Z
  14. Yahoo2026-10-22T09:17:21.000Z
  15. Yahoo2026-10-22T02:22:56.000Z
  16. Yahoo2026-10-21T23:23:23.000Z
  17. Yahoo2026-10-22T09:05:00.000Z
  18. Yahoo2026-10-22T08:47:00.000Z
  19. Yahoo2026-10-22T09:45:00.000Z
  20. Yahoo2026-10-22T09:19:24.000Z
  21. Yahoo2026-10-22T09:00:00.000Z
  22. Yahoo2026-10-22T03:14:51.000Z
  23. Yahoo2026-10-22T01:57:02.000Z
  24. Yahoo2026-10-22T08:28:37.000Z
ES / MESE-mini / Micro E-mini S&P 500Weekly thesis · STRESSED

The Lines in the Sand

7,749.97Falling hourly average capping every bounce so far
7,710.25Overnight low; a close under it opens fresh downside
7,676Last week's low, still untouched, the weekly floor

The Trap

The crowd tends to chase weakness after the range is already stretched, then gets squeezed when the weekly floor around 7679 and 7676 holds. Bounce fans get caught the other way, reading every push into 7751-7760 as a turn while the hourly average keeps pressing down.

Last price7,722
ADR · 30 sessions79.76 pts
Daily EMA217,785.63BELOW
Reopen gapDOWN · -3 ptsOpen · 0.038 ADR
7,6807,7007,7207,7407,7607,7807,8007,8207,840Thu 9:30close 16:00Fri 9:30close 16:00Mon 9:30close 16:00Tue 9:30close 16:00Wed 9:30close 16:00Gap fill · 7,800Prior week low · 7,676H1 · EMA21 · ES / MES 7,722Dashed: last night's path
Overnight: invalidated

The Read

INVALIDATED

Bears never got a real swing this week: price held above last week's low of 7676 without a single sweep, and bulls have walked the S&P from 7679 to 7800. The daily close sits above its 7785.63 average with above-average volume behind it, which is cleaner trend footing than the Nasdaq has. That leans bullish, but the close was quiet, the day's normal range is mostly used up, and the overnight hours are historically a slow slot. The counter-argument with teeth is rates: markets still price a further Fed hike by year-end, a headwind that today's close ignored. Accept above 7811.75 and the door opens to 7830-7850 with 7887 beyond; an hourly close below 7770 and the push is off.

Morning review · Oct 22, 7:30 AM EDT

Bears flipped the tape overnight, driving price from 7798.75 down to 7710.25 and parking it at 7722, back under the 7785.63 daily average the prior session had held. The bulls' best card is the weekly chart, still green above the 7679 open with last week's 7676 low untouched. The pressure leans lower, but more than a full day's normal range is already spent ahead of jobless claims and the 13:00 ET TIPS auction. Close under 7710.25 and the door opens toward 7676; reclaim 7749.97 and the slide loses its grip, and 7798.75 is the bulls' way back.

Overnight evidence · 10 cited findings

Overnight price action

  • From the prior evening baseline, MES traded from 7798.75 down to 7710.25 and was 75 points lower at 7722.
  • The overnight range measured 88.5 points, or 1.11 ADR, with the H1 sequence remaining below its declining EMA21.
  • The 05:00-06:00 bounce from 7710.25 to 7722 did not reclaim the 7749.97 H1 EMA21.

Overnight events

  • Meta and Tesla reactions did not preserve the prior bullish index setup; current reporting instead showed lower S&P 500 futures. https://www.wsj.com/livecoverage/stock-market-today-dow-sp-500-nasdaq-10-22-2026
  • The jobless-claims outcome remained pending at 07:33 ET; only the prior 199,000 observation was verified. https://fred.stlouisfed.org/series/ICSA
  • The exact direction of Treasury yields could not be established from a timestamped primary quote.

What changed

  • Price action reverses the prior bullish read to bearish and makes the verdict INVALIDATED.
  • Risk-off reporting supports the confidence assessment but does not determine direction.
  • Green weekly structure above 7676 is the primary counterweight and prevents calling a confirmed weekly breakdown.
  • A close below 7710.25 activates the downside expansion scenario; recovery above 7749.97 weakens it.
Yesterday's daily candle · Wed, Oct 21
Open7,785.5High7,811.75Low7,751Close7,800
bullish · range 60.75 pts
Projected range · next session66 pts7,778 – 7,844

Index drivers

Most heavyweights closed the prior regular session higher, led by NVDA, TSLA, AMD, MU and AAPL, while GOOGL and GOOG fell and AMZN and BRK.B slipped slightly; those closes came before the overnight reversal. Headlines flagged Meta's revenue beat and Tesla's lower annual sales goal. Amazon reports October 29, Apple November 2 and AMD November 3, all after the close.

Market data as of Oct 22, 7:33 AM EDT · Weights as of 2026-10-01

Evidence · 11 cited findings

Price action · weekly / daily / H1

  • Daily closed bullish at 7800 (range 7751-7811.75), holding above the 7785.63 EMA21 (HOLD, +0.18 ADR). That is stronger trend alignment than MNQ despite a modest 0.2387 body ratio.
  • H1 is above its rising 7781.75 EMA21 after rejecting the 7751 low. Acceptance above 7811.75 opens 7830-7850, and a close below 7770 would negate immediate continuation.
  • The H1 close of 7800 sits just under the session high of 7811.75 and 7806 on the last bar. The 16:00 bar range was only 8.25, so the close was quiet.

Metrics

  • Volume was 1.255x the 30-day average on the up close, confirming participation.
  • ADR30 is 79.76 and 0.762 is used, leaving about 19 points of daily ADR budget. The H1 expansion threshold is 18.5 and the last H1 range was 8.25, so the market is not expanding now.
  • Top historical expansion hours are 9-13 and 15 ET, so the overnight next session is a lower-probability slot (contradiction).
  • Weekly thesis arithmetic (RED) requires 121 points against 159.52 remaining ADR budget. The ratio is 0.759, verdict TIGHT.

Sentiment & current events

  • S&P cash closed 7757.17 (+0.58%) against prior 7712.57 (FRED-confirmed), with VIX at 16.68 and the 10-yr at 5.15%. The 7800 futures level against 7757 cash is a plausible carry premium. https://finance.yahoo.com/quote/%5EGSPC/history/
  • Heavyweights: NVDA +2.54%, AAPL +1.32%, AMD +3.36%, MU +1.96%, GOOGL -1.62%. META +3% after hours on a revenue beat and narrowed AI capex outlook. https://finnhub.io/api/news?id=7fd9fc050818426fc2656dd07b8e72bd56c66c0618d7d1327983f1a7ef2ceed6
  • Tesla after-hours direction is unresolved (mixed results, conflicting headlines). https://finnhub.io/api/news?id=e182ae874ab110da2a949194881a6a166b8c3e694146854dd8cd301bab57035e
  • Fed: hold priced for Oct 27-28 with about 15-17% hike odds and about 85% for a further hike by year-end. This is a rate headwind for equities that is not yet reflected in the daily close. https://uk.finance.yahoo.com/news/gold-falls-near-4-110-020012559.html
Sources & evidence dates · 33
  1. S&P 500 cash index closed 10/21 at 7,757.17 (+0.58%). Dow closed 52,856.09 (+0.69%), Nasdaq Composite 26,702.86 (+1.05%), 10-yr yield 5.15%, VIX 16.68. The S&P prior close was 7,712.57, confirmed by FRED. This supports the MES bullish daily close (7,800 futures against 7,757 cash is a plausible carry premium) and the MNQ recovery.2026-10-21T16:31:21-04:00
  2. uk.finance.yahoo.com2026-10-21
  3. ir.tesla.com2026-10-21
  4. wsj.com2026-10-21T16:52:00-04:00
  5. finance.yahoo.com2026-10-21T16:31:21-04:00
  6. straits.live2026-10-21
  7. US data context for 10/20: September housing starts and permits slowed, and pending home sales fell 7.3% month on month (a record low per another report). Equities still rose, with the S&P up 0.3% and the Nasdaq about flat. Softening-economy data and lower long-end yields briefly supported bonds.2026-10-21
  8. Yahoo2026-10-22T09:39:00.000Z
  9. Yahoo2026-10-22T09:26:48.000Z
  10. Yahoo2026-10-22T09:26:01.000Z
  11. Yahoo2026-10-22T09:19:00.000Z
  12. Yahoo2026-10-22T08:17:52.000Z
  13. Yahoo2026-10-22T08:15:02.000Z
  14. Yahoo2026-10-22T09:17:21.000Z
  15. Yahoo2026-10-22T02:22:56.000Z
  16. Yahoo2026-10-21T23:23:23.000Z
  17. Yahoo2026-10-22T09:05:00.000Z
  18. Yahoo2026-10-22T08:47:00.000Z
  19. Yahoo2026-10-22T09:45:00.000Z
  20. Yahoo2026-10-22T09:19:24.000Z
  21. Yahoo2026-10-22T09:00:00.000Z
  22. Yahoo2026-10-22T03:14:51.000Z
  23. Yahoo2026-10-22T01:57:02.000Z
  24. Yahoo2026-10-22T08:28:37.000Z
  25. Yahoo2026-10-22T09:11:41.000Z
  26. Yahoo2026-10-22T08:22:00.000Z
  27. Yahoo2026-10-22T08:02:00.000Z
  28. Yahoo2026-10-22T03:17:30.000Z
  29. Yahoo2026-10-22T01:22:53.000Z
  30. Yahoo2026-10-21T23:58:39.000Z
  31. Yahoo2026-10-22T07:19:25.000Z
  32. Yahoo2026-10-21T20:07:00.000Z
  33. Yahoo2026-10-21T19:27:00.000Z
GC / MGCGold / Micro GoldWeekly thesis · STRESSED

The Lines in the Sand

4,094.8Last week's low, swept but not accepted below yet
4,082.3Overnight low; the floor bears still have to crack
4,121.58Declining hourly average where rebounds keep failing

The Trap

Late shorts tend to press right into a swept weekly low after a full day's range is already spent, which is the classic spot for a snap-back. Bottom-pickers get hurt too, declaring the low on every bounce while price keeps failing under 4121.58.

Last price4,096
ADR · 30 sessions80.91 pts
Daily EMA214,212.69BELOW
Reopen gapNo opening gap
4,0804,1004,1204,1404,1604,1804,2004,220Thu 8:20close 13:30Fri 8:20close 13:30Mon 8:20close 13:30Tue 8:20close 13:30Wed 8:20close 13:30Prior week low · 4,094.8H1 · EMA21 · GC / MGC 4,096Dashed: last night's path

The Read

Bears own the week with price stuck under the 4185.1 open, but bulls fought back today from 4122.4 to a 4159 close. That bounce came on below-average volume and still sits far below the 4212.69 daily average, so neither side has the upper hand. There is no clear edge here: the hourly chart reclaimed its average, while rate-hike expectations keep weighing on bullion. One more warning: other price feeds do not agree on today's close, so the exact levels deserve a lighter grip than usual. The evening hour has historically been an active one for gold, so the fight may not wait for morning. Hold above 4122.4 and a push into the 4170-4185 zone is in play; break 4122.4 and the floor is gone.

Morning review · Oct 22, 7:30 AM EDT

Bears drove gold from 4159 down to 4082.3 overnight, and it sits at 4096, far under the 4212.69 daily average, with the weekly candle red. But the dip below last week's 4094.8 low has not been accepted, and that sweep is the bulls' best argument. There is no clear edge either way: momentum points down, and a reversal setup sits right underneath it. Lose 4082.3 on a close and the floor gives way; reclaim 4121.58 and the bears lose control, with 4164.9 the line that would turn the tide.

Overnight evidence · 10 cited findings

Overnight price action

  • From the evening baseline, MGC traded from 4164.9 down to 4082.3 and was 63 points lower at 4096.
  • The overnight range measured 82.6 points, or 1.021 ADR, with price remaining below its declining H1 EMA21.
  • The prior path projected 4166-4174 and a 4162 close; supplied bars instead broke 4122.4 and declined toward the prior-week low.
  • The 05:00 bounce to 4104.2 failed, and the 06:00 bar closed back at 4096.

Overnight events

  • The scheduled 08:30 ET jobless-claims release remained pending at the cutoff. https://fred.stlouisfed.org/series/ICSA
  • No timestamped primary DXY or real-yield observations were available to independently attribute the overnight gold decline.

What changed

  • Price action changes the prior flat read to bearish, producing an adjusted verdict.
  • Weekly RED structure and daily/H1 momentum support the change.
  • The unaccepted prior-week-low sweep and structural gold demand are the main reversal risks.
  • A close below 4082.3 activates renewed downside expansion; recovery above 4121.58 weakens the bearish scenario.
Yesterday's daily candle · Wed, Oct 21
Open4,143.9High4,160.8Low4,122.4Close4,159
bullish · range 38.4 pts
Projected range · next session45 pts4,137 – 4,182
⚠ Flat / choppy conditions likely
Evidence · 10 cited findings

Price action · weekly / daily / H1

  • Weekly stays below its 4185.1 open and the prior-week close of 4186.5 (bearish candle). It has neither swept nor accepted beyond the prior-week boundaries (4094.8-4242.3), which preserves a RED weekly read.
  • Daily recovered from a 4122.4 low to a bullish 4159 close but remains 0.664 ADR below the 4212.69 EMA21 (event REJECT). The bounce lacks higher-timeframe confirmation.
  • H1 reclaimed its 4146.33 EMA21 after a sharp 14:00 rejection (low of that bar 4131.2) and a 15:00 reversal. That favors consolidation or a limited test of 4170-4185 unless 4122.4 breaks and restores downside momentum.
  • Direction is flat: the bounce and the weekly bearish structure offset, with a range of 4122.4-4160.8 for the session.

Metrics

  • Daily volume was 0.821x the 30-day average, so the bounce had below-average participation.
  • ADR30 is 80.91 and only 0.475 was used, leaving large room (about 42 points) for movement. The H1 expansion threshold is 23.9 and the last range was 10.1, so the market is not expanding now.
  • Top expansion hours (ET) are 10, 9, 21, 11, 8, 12, so the 21:00 hour is a historically active slot for gold.
  • Weekly flat thesis arithmetic: required 12.78 points against 161.83 remaining ADR budget, ratio 0.079, COMFORTABLE.

Sentiment & current events

  • Higher borrowing costs and hike expectations weigh on bullion, down about 1% on the week and about a fifth below the pre-war level. Gold rallied briefly on oil-down headlines and gave it back. DXY is about 101.80. https://uk.finance.yahoo.com/news/gold-falls-near-4-110-020012559.html
  • Fed: hold priced for Oct 27-28 with about 15-17% hike odds and about 85% for a further hike by year-end. This is a headwind that argues against reading the bounce as a reversal.
Sources & evidence dates · 4
  1. uk.finance.yahoo.com2026-10-21
  2. Gold level: the price action has MGC closing the daily at 4,159 as a bullish recovery. Barchart's Dec gold (GCZ26) shows 4,132.9 (-9.7), implying a prior settle of about 4,142.6. Yahoo's 'Gold' line shows 4,154.20 (+0.10%) at the US close. Investing.com shows spot at 4,108.58 (-0.4%) and futures at 4,126.55. Spread and roll basis explain some of the gap, but the 4,159 'bullish recovery close' is not corroborated by two of the sources, and the narrative is 'gold falling as Iran peace hopes fade', which does not match the bullish-recovery reading.2026-10-21
  3. Gold drivers: higher borrowing costs and rate-hike expectations weigh on bullion, which is down about 1% on the week and about a fifth below the pre-war level. Gold briefly rallied on oil-down headlines and then surrendered the gains as oil recovered. The dollar index was about 101.80. This supports the flat/RED weekly stance for MGC and contradicts any reading of the MGC bounce as a trend reversal.2026-10-21
  4. straits.live2026-10-21
CL / MCLWTI Crude Oil / Micro WTI Crude OilWeekly thesis · FULFILLED

The Lines in the Sand

100.08Session high; a close above restarts the upside push
98.72Hourly support; lose it and the bid fades
97.72Session low and filled gap; below it bears take over

The Trap

Breakout chasers tend to pile in on the first poke above 100.08, the same zone where last week's 99.35 high already failed to hold, and crowded positioning there makes a quick flush likely. Headline-driven bears get caught the other way while price stays above its rising hourly average.

Last price99.14
ADR · 30 sessions3.81 pts
Daily EMA2192.97ABOVE
Reopen gapUP · 0.08 ptsFilled
9293949596979899100101102Thu 9:00close 14:30Fri 9:00close 14:30Mon 9:00close 14:30Tue 9:00close 14:30Wed 9:00close 14:30Prior week high · 99.35H1 · EMA21 · CL / MCL 99.14Dashed: last night's path
Overnight: invalidated

The Read

INVALIDATED

Bulls punched crude to 101.37, above last week's high of 99.35, and then could not hold the ground. Price fell back under the 99.07 weekly open and closed at 97.72, far off the high, on volume several times normal with no clear explanation. That failed breakout gives bears a slight edge, and the hourly chart keeps failing in the 99.5-100.4 area. The counter-argument is real: supplied fundamentals describe a tight physical market, and price data does not reconcile across sources, so the levels are unconfirmed. Today's range is already spent, which argues against a big overnight move. Close below 97.45 and 96.6, then 96.26, come into view; recover 98.62 on the hourly and the bearish path is neutralized.

Morning review · Oct 22, 7:30 AM EDT

Bulls reversed the overnight script, lifting crude from 97.80 to 100.08 on volume about twice the 30-day norm, and price holds 99.14 above a rising hourly average. The bears' tell sits overhead: price poked above last week's 99.35 high but could not stay there, and positioning up here was described as crowded. The lean is slightly higher, with the oil supply-shock headlines as the fuel. Close above 100.08 and the door opens; break 98.72 and the push stalls, and below 97.72 the floor is gone.

Overnight evidence · 10 cited findings

Overnight price action

  • From the evening baseline, MCL traded from 97.72 up to 100.08 and was 1.34 points higher at 99.14.
  • The overnight range measured 2.36 points, or 0.62 ADR, and price remained above the rising H1 EMA21 at 98.76.
  • The prior path projected a decline toward 96.72 and a 96.95 close; supplied bars instead advanced through 98.62 and reached 100.08.
  • The 05:00-06:00 pullback from 100.00 to 99.14 is corrective while price holds above 98.72-98.76.

Overnight events

  • Contemporaneous reporting corroborated an oil-supply shock and Brent above $111. https://www.wsj.com/livecoverage/stock-market-today-dow-sp-500-nasdaq-10-22-2026
  • Diplomacy and Hormuz narratives remained unresolved and could reverse the supply premium.

What changed

  • Price action reverses the prior bearish read to bullish and makes the verdict INVALIDATED.
  • Strong developing volume and the oil-supply-shock report support confidence but do not determine direction.
  • Rejection at 100.08 and failure to accept above 99.35 are the main contradictions.
  • A close above 100.08 activates upside expansion; a sustained break below 98.72 weakens the bullish scenario.
Yesterday's daily candle · Wed, Oct 21
Open98.18High100.41Low96.26Close97.72
doji · range 4.15 pts
Projected range · next session2.1 pts96.38 – 98.48
Evidence · 10 cited findings

Price action · weekly / daily / H1

  • The weekly high of 101.37 swept the prior-week high of 99.35 but price failed to accept above it and now trades below the 99.07 weekly open (bearish weekly candle). That failed breakout supports a RED close.
  • Daily printed a doji (range 96.26-100.41, 1.09 ADR) with the close at 97.72, well below the 100.41 high. That confirms rejection even though price remains above the 92.97 EMA21.
  • H1 closed below its 98.07 EMA21 after repeated failures around 99.5-100.4. A close below 97.45 favors 96.6, then 96.26; recovery above 98.62 would neutralize the bearish path.
  • The weekly low is 95.26 (10/20 10:00 bar), so the downside test of 96.26 sits above that sweep.

Metrics

  • Daily volume was 6.874x the 30-day average, an extreme reading that is not explained in the evidence (UNKNOWN cause).
  • The daily range used 1.09 ADR (ADR30 3.81), so the day's range budget is already exhausted. The H1 expansion threshold is 0.82 and the last range was 0.51, so the market is not expanding now.
  • Top historical expansion hours (ET) are 10, 9, 11, 12, 4 and 8, so the overnight window is a lower-probability slot except around 04:00.
  • Weekly bullish weekly view arithmetic: required 1.35 against 7.61 remaining ADR budget, ratio 0.177, COMFORTABLE, though price is below the thesis invalidation.

Sentiment & current events

  • Brent Dec settled $108.79 on 10/20 after a $111.99 high on US-Iran diplomacy hopes, showing two-way headline reversals. The 10/21 settlement was not retrieved, so this is SUPERSEDED context. https://www.cnbc.com/2026/10/20/oil-price-wti-brent-crude.html
  • Supplied fundamentals describe a tight physical balance (inventory draws, steep backwardation, upside-skewed risk premium), which fights a bearish read. A peace headline is the main support for it. These inputs are not primary-verified.
Sources & evidence dates · 3
  1. cnbc.com2026-10-20
  2. commoditypriceapi.com2026-10-21
  3. straits.live2026-10-21

Free. Always. Futures trading edge in your inbox.

You're in. Watch your inbox.

We do not send junk mail. We do not spam.