Session Prep

Two minutes tonight. A plan tomorrow.
Evening edition · Data as of Tue, Oct 20, 5:00 PM EDT · All times Eastern
Deep research

Tonight's one thing

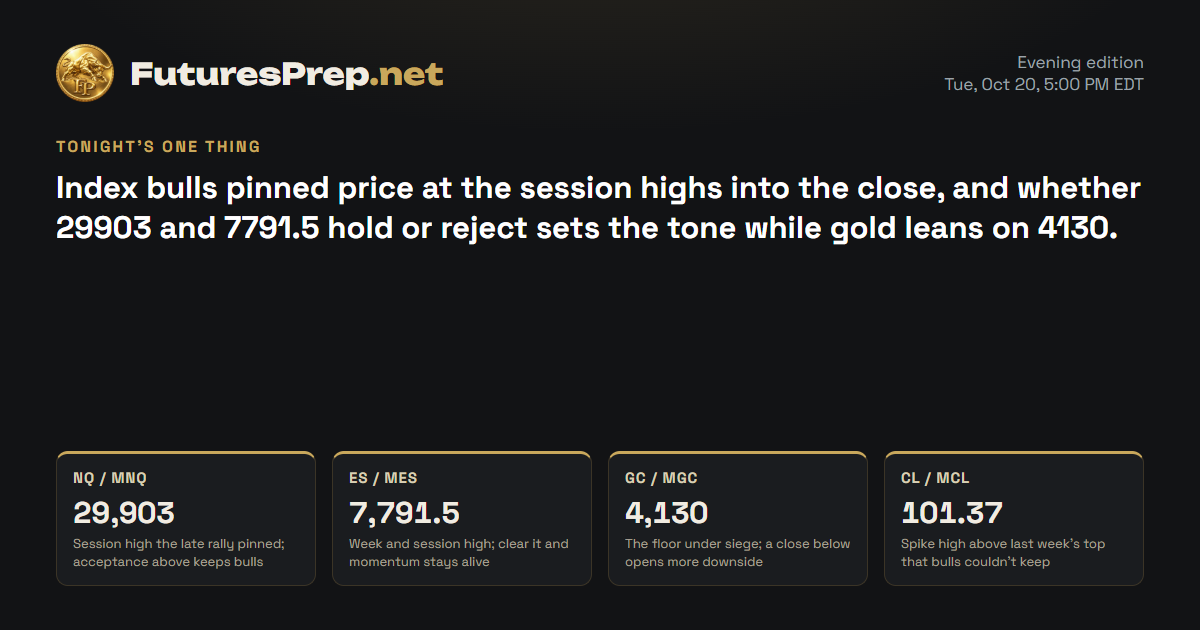
Index bulls pinned price at the session highs into the close, and whether 29903 and 7791.5 hold or reject sets the tone while gold leans on 4130.

Tomorrow's market movers · Wednesday, October 21

No major U.S. releases or tracked driver earnings scheduled.

U.S. releases, high and medium impact.

NQ / MNQE-mini / Micro E-mini Nasdaq-100Weekly thesis · STRESSED

The Lines in the Sand

29,903Session high the late rally pinned; acceptance above keeps bulls driving
29,202The sweep low where bears pushed and failed to hold
30,393.19Falling 21-day average overhead, the ceiling on this bounce

The Trap

Late shorts who leaned on the broken weekly low got squeezed as price ripped back. Now the crowd piles in late at the highs after a big hourly pop and gets caught when the high rejects and price slides back into 29720-29650.

Last price29,893.5
ADR · 30 sessions497.63 pts
Daily EMA2130,393.19REJECT
Reopen gapNo opening gap
29,20029,40029,60029,80030,00030,20030,40030,60030,80031,000close 16:00Wed 9:30close 16:00Thu 9:30close 16:00Fri 9:30close 16:00Mon 9:30close 16:00Tue 9:30close 16:00Prior week low · 29,268.75H1 · EMA21 · NQ / MNQ 29,893.5Yellow: 09:30 open · dashed gray: 16:00 close (ET)

The Read

Bears dragged the week under last week's low at 29268.75, tagged 29202, and couldn't make it stick. Bulls took it back to 29893.5, and the last hour exploded into the close, parked just under the 29903 high on heavy volume. The catch is that price still sits well below a falling 21-day average at 30393.19, so this is a bounce inside a downtrend. Rising rate-hike expectations and red megacaps cut against it. Hold above 29903 and the door opens toward 30000; lose 29720 and the bounce starts to look like the trap.

Yesterday's daily candle · Tue, Oct 20
Open29,744.25High29,903Low29,391.25Close29,893.5
bullish · range 511.75 pts
Projected range · next session410 pts29,710 – 30,120

Index drivers

Most heavyweights closed lower: Apple, Meta and Alphabet took the bigger hits, while Nvidia, Microsoft and Broadcom slipped slightly. Tesla was the standout gainer on SpaceX results and merger talk, and Amazon barely moved. Microsoft and Alphabet report on Oct 28 and Amazon on Oct 29, all outside this window.

Market data as of Oct 20, 6:33 PM EDT · Weights as of 2026-09-30

Evidence · 12 cited findings

Price action · weekly / daily / H1

  • Weekly swept the prior-week low at 29268.75 (week low 29202) but did not accept below it, then recovered to 29893.5; this failed breakdown supports a green weekly close while 29202 holds.
  • Daily printed a bullish reversal from 29391.25 on 1.38x average volume, but the close is still about 1.0 ADR below the falling 21-day EMA at 30393.19, so this is a countertrend recovery.
  • The final H1 bar was a 212.75-point expansion closing at 29893.5, near the session high of 29903. Acceptance above 29903 favors continuation; rejection exposes 29720-29650 support.
  • No gap is present into the session open (prior close 29893.5).

Metrics

  • Daily volume was 1.378x the 30-day average, which supports the reversal.
  • Daily range used 1.03 ADR (ADR30 497.63). The 105-point H1 expansion threshold was exceeded on the final bar.
  • Engine EMA21 event is REJECT with the close 1.004 ADR below the EMA, which caps the quality of the bounce.
  • Weekly arithmetic check: the 663.75-point floor needs 0.445 of the remaining ADR budget (COMFORTABLE).

Sentiment & current events

  • Wells Fargo (S2) says rate-hike expectations rose on Oct 19. This hawkish backdrop opposes a clean bullish read. https://www.wellsfargoadvisors.com/research-analysis/commentary/stock-market-news.htm
  • Delayed ETF data (S3, grade C) showed Nasdaq 100 +0.83% and S&P 500 +0.63% on Oct 20, consistent with the bullish daily reversal; the index levels are unreconciled with futures. https://stocksetups.com/today
  • Basket drivers were mixed: NVDA -0.29%, MSFT -0.31%, AAPL -1.00%, META -1.59%, GOOGL -1.13%, TSLA +1.54% (SpaceX results and Tesla merger talk). https://finnhub.io/api/news?id=bfdab3bda91173090c726275f085298c181d3598ff667ef060dfbbe3ac5e2c18
  • Breadth headline: the rally is broadening beyond Big Tech. https://finnhub.io/api/news?id=01d44bae4113a6f983cb1fa1539024539ab713f271a6ee4d6cadae9e501d1b5a
Sources & evidence dates · 23
  1. stocksetups.com2026-10-20
  2. Wells Fargo's Oct 20 opening comment says market expectations for Fed rate hikes rose on Oct 19, and Fed officials (Waller, Oct 8) have said more hikes may be needed. This is a hawkish backdrop that conflicts with a clean bullish equity and gold-neutral read. Housing starts, pending home sales and building permits were due Oct 20.2026-10-20
  3. Supplied claim: 'on Oct 19 the oil decline pulled US Treasury yields lower'. This is CONTRADICTED by price data: Brent rose 1.30% on Oct 19 (settle 109.55) and Nov WTI closed up 2.25 (+2.22%). Any attribution of the Oct 19 Treasury yield drop to falling oil is unsupported.2026-10-20
  4. flashalpha.com2026-10-02
  5. Yahoo2026-10-20T21:32:39.000Z
  6. Yahoo2026-10-20T21:28:00.000Z
  7. Yahoo2026-10-20T21:25:00.000Z
  8. Yahoo2026-10-20T20:20:36.000Z
  9. Yahoo2026-10-20T20:16:04.000Z
  10. Yahoo2026-10-20T20:09:25.000Z
  11. Yahoo2026-10-20T21:05:36.000Z
  12. Yahoo2026-10-20T20:48:17.000Z
  13. Yahoo2026-10-20T20:45:02.000Z
  14. Yahoo2026-10-20T21:40:18.000Z
  15. Yahoo2026-10-20T21:09:01.000Z
  16. Yahoo2026-10-20T21:34:46.000Z
  17. Yahoo2026-10-20T20:43:01.000Z
  18. Yahoo2026-10-20T20:27:24.000Z
  19. Yahoo2026-10-20T21:30:57.000Z
  20. Yahoo2026-10-20T19:05:02.000Z
  21. Yahoo2026-10-20T20:45:04.000Z
  22. Yahoo2026-10-20T21:57:18.000Z
  23. Yahoo2026-10-20T21:37:12.000Z
ES / MESE-mini / Micro E-mini S&P 500Weekly thesis · STRESSED

The Lines in the Sand

7,791.5Week and session high; clear it and momentum stays alive
7,784.2121-day average just reclaimed by a hair, still unproven
7,759Lose it and the late push runs out of fuel

The Trap

A close jammed against the high and a barely reclaimed average catches the crowd offside both ways. Chasers who pile in at the highs get shaken out on a rejection, and early shorts fading the reclaim get run over if price accepts above.

Last price7,784.75
ADR · 30 sessions79.83 pts
Daily EMA217,784.21RECLAIM
Reopen gapNo opening gap
7,6757,7007,7257,7507,7757,8007,8257,8507,875close 16:00Wed 9:30close 16:00Thu 9:30close 16:00Fri 9:30close 16:00Mon 9:30close 16:00Tue 9:30close 16:00Prior week high · 7,887Prior week low · 7,676H1 · EMA21 · ES / MES 7,784.75Yellow: 09:30 open · dashed gray: 16:00 close (ET)

The Read

Bears never got last week's low at 7676, and bulls walked price from 7677.5 up to 7784.75, back on top of the 21-day average at 7784.21. That reclaim is paper-thin, with the close barely above the line and just under the 7791.5 high. Breadth backed the move as advancers outnumbered decliners and small caps joined in, but Apple, Meta and Alphabet weighed on the tape, and rising rate-hike expectations hang overhead. Clear 7791.5 and the door opens toward last week's 7887 high; lose 7759 and the push loses its fuel.

Yesterday's daily candle · Tue, Oct 20
Open7,741High7,791.5Low7,704.5Close7,784.75
bullish · range 87 pts
Projected range · next session74 pts7,758 – 7,832

Index drivers

The heaviest names were mostly soft: Apple, Meta, Alphabet and Micron fell, and Nvidia and Microsoft slipped slightly. Berkshire and Tesla carried the green side, and Amazon barely moved. Microsoft and Alphabet report on Oct 28, Amazon on Oct 29, Apple on Nov 2 and AMD on Nov 3, all outside this window.

Market data as of Oct 20, 6:33 PM EDT · Weights as of 2026-10-01

Evidence · 12 cited findings

Price action · weekly / daily / H1

  • Weekly advanced from 7677.5 to 7784.75 without taking the prior-week low at 7676, holding above the 7679 weekly open. The prior-week high at 7887 is the upside reference.
  • Daily reclaimed the 21-day EMA (7784.21) with a 50% bullish body. The close is only 0.007 ADR above the EMA, so the reclaim is marginal.
  • The final H1 bar was a 27.5-point expansion closing at 7784.75, near its high of 7786.5. Acceptance above 7791.5 favors continuation; loss of 7759 negates the immediate momentum.
  • No gap is present into the session open (prior close 7784.75).

Metrics

  • Daily volume was 1.337x the 30-day average, which supports the reclaim.
  • Daily range used 1.09 ADR (ADR30 79.83). The 18.5-point H1 expansion threshold was exceeded on the final bar.
  • Engine EMA21 event is RECLAIM and still needs confirmation.
  • Weekly arithmetic check: the 105.75-point floor needs 0.442 of the remaining ADR budget (COMFORTABLE).

Sentiment & current events

  • Wells Fargo (S2) says rate-hike expectations rose on Oct 19, a hawkish backdrop that opposes the bullish read. https://www.wellsfargoadvisors.com/research-analysis/commentary/stock-market-news.htm
  • Delayed ETF data (S3, grade C) showed S&P 500 +0.63% and Dow +1.14% on Oct 20, with 6,624 advancers vs 2,924 decliners, consistent with the daily reclaim. Index levels are unreconciled with MES. https://stocksetups.com/today
  • SPY-weighted drivers were mixed: AAPL -1.00%, META -1.59%, GOOGL -1.13%, MU -0.98%, NVDA -0.29%, while BRK.B +1.43% and TSLA +1.54%. https://finnhub.io/api/news?id=6efcf496b49209d6d230e15917e232276b948288ff21a77503c61ee118c38eb5
  • Headline: Dow jumps on U.S.-Iran hopes, and small caps pop as the rally broadens. https://finnhub.io/api/news?id=01d44bae4113a6f983cb1fa1539024539ab713f271a6ee4d6cadae9e501d1b5a
Sources & evidence dates · 29
  1. stocksetups.com2026-10-20
  2. Wells Fargo's Oct 20 opening comment says market expectations for Fed rate hikes rose on Oct 19, and Fed officials (Waller, Oct 8) have said more hikes may be needed. This is a hawkish backdrop that conflicts with a clean bullish equity and gold-neutral read. Housing starts, pending home sales and building permits were due Oct 20.2026-10-20
  3. Supplied claim: 'on Oct 19 the oil decline pulled US Treasury yields lower'. This is CONTRADICTED by price data: Brent rose 1.30% on Oct 19 (settle 109.55) and Nov WTI closed up 2.25 (+2.22%). Any attribution of the Oct 19 Treasury yield drop to falling oil is unsupported.2026-10-20
  4. Yahoo2026-10-20T21:32:39.000Z
  5. Yahoo2026-10-20T21:28:00.000Z
  6. Yahoo2026-10-20T21:25:00.000Z
  7. Yahoo2026-10-20T20:20:36.000Z
  8. Yahoo2026-10-20T20:16:04.000Z
  9. Yahoo2026-10-20T20:09:25.000Z
  10. Yahoo2026-10-20T21:05:36.000Z
  11. Yahoo2026-10-20T20:48:17.000Z
  12. Yahoo2026-10-20T20:45:02.000Z
  13. Yahoo2026-10-20T21:40:18.000Z
  14. Yahoo2026-10-20T21:09:01.000Z
  15. Yahoo2026-10-20T21:34:46.000Z
  16. Yahoo2026-10-20T20:43:01.000Z
  17. Yahoo2026-10-20T20:27:24.000Z
  18. Yahoo2026-10-20T21:30:57.000Z
  19. Yahoo2026-10-20T19:05:02.000Z
  20. Yahoo2026-10-20T20:45:04.000Z
  21. Yahoo2026-10-20T21:57:18.000Z
  22. Yahoo2026-10-20T21:37:12.000Z
  23. Yahoo2026-10-20T19:33:00.000Z
  24. Yahoo2026-10-20T19:13:06.000Z
  25. Yahoo2026-10-20T18:53:30.000Z
  26. Yahoo2026-10-20T18:51:00.000Z
  27. Yahoo2026-10-20T10:35:00.000Z
  28. Yahoo2026-10-20T07:50:00.000Z
  29. Yahoo2026-10-19T23:00:00.000Z
GC / MGCGold / Micro GoldWeekly thesis · INTACT

The Lines in the Sand

4,130The floor under siege; a close below opens more downside
4,094.8Last week's low, the next stop-off if 4130 cracks
4,211.2The failed weekly high that set the lower high

The Trap

In a tight, low-volume tape, bears tend to pile on at the first poke under 4130 and get caught when price snaps back into the 4150-4175 shelf. Bulls who fade the drop early have been rejected at that same shelf again and again.

Last price4,142.5
ADR · 30 sessions82.79 pts
Daily EMA214,217.47REJECT
Reopen gapNo opening gap
4,1004,1204,1404,1604,1804,2004,220close 13:30Wed 8:20close 13:30Thu 8:20close 13:30Fri 8:20close 13:30Mon 8:20close 13:30Tue 8:20close 13:30Prior week low · 4,094.8H1 · EMA21 · GC / MGC 4,142.5Yellow: 08:20 open · dashed gray: 13:30 close (ET)

The Read

Bears hold the edge but haven't finished the job. Gold failed at 4211.2, slipped under the 4185.1 weekly open, and is now leaning on 4130 after repeated rejections in the 4150-4175 zone. Close below 4130 and the floor opens toward last week's 4094.8 low; reclaim the 4150-4175 shelf and the bears are the ones offside.

Yesterday's daily candle · Tue, Oct 20
Open4,160.5High4,174.9Low4,130Close4,142.5
bearish · range 44.9 pts
Projected range · next session64 pts4,098 – 4,162
Evidence · 10 cited findings

Price action · weekly / daily / H1

  • Weekly price is below the 4185.1 open and the prior-week close of 4186.5, after failing at a 4211.2 high. That keeps a lower-high sequence, with 4094.8 (prior-week low) as the next downside reference.
  • Daily closed bearish at 4142.5, about 0.91 ADR below the 21-day EMA at 4217.47. Range used was only 0.54 ADR, leaving room for downside expansion.
  • H1 stays below its EMA after repeated failures around 4150-4175. Support at 4130 is being tested, so a close below 4130 is needed to unlock 4105-4095; compression argues against chasing.
  • No gap is present into the session open (prior close 4142.5).

Metrics

  • Daily volume was 0.785x the 30-day average, so the bearish close lacks volume confirmation.
  • The H1 expansion threshold is 23.9 points. The last bar's range was 5.5 points, so there is no active expansion (6 bars since expansion).
  • Engine EMA21 event is REJECT with the close 0.906 ADR below the EMA.
  • Weekly arithmetic check: the 30.42-point floor needs 0.122 of the remaining ADR budget (COMFORTABLE).

Sentiment & current events

  • Spot gold was about 4,121-4,125 on Oct 20 (-0.44% to -0.5%, day range 4,112.86-4,143.59), consistent with the bearish futures close. The 4,130 trigger is only about $5-7 away. https://pricegold.net/us-united-states/
  • Wells Fargo (S2) says rate-hike expectations rose on Oct 19. This supports pressure on gold, though it is not a primary driver here. https://www.wellsfargoadvisors.com/research-analysis/commentary/stock-market-news.htm
Sources & evidence dates · 3
  1. Spot gold was about $4,121–4,125 on Oct 20, down about 0.44–0.5% (day range 4,112.86–4,143.59). The Oct 19 close was about 4,146.54 (-0.87%). This matches the price action daily close of 4,142.5 within a few dollars, so it is consistent with MGC staying below the weekly open of 4,185.1. It leaves gold about 0.5% under that close, and the 4,130 downside trigger sits only about $5–7 away from spot.2026-10-20
  2. Wells Fargo's Oct 20 opening comment says market expectations for Fed rate hikes rose on Oct 19, and Fed officials (Waller, Oct 8) have said more hikes may be needed. This is a hawkish backdrop that conflicts with a clean bullish equity and gold-neutral read. Housing starts, pending home sales and building permits were due Oct 20.2026-10-20
  3. Supplied claim: 'on Oct 19 the oil decline pulled US Treasury yields lower'. This is CONTRADICTED by price data: Brent rose 1.30% on Oct 19 (settle 109.55) and Nov WTI closed up 2.25 (+2.22%). Any attribution of the Oct 19 Treasury yield drop to falling oil is unsupported.2026-10-20
CL / MCLWTI Crude Oil / Micro WTI Crude OilWeekly thesis · STRESSED

The Lines in the Sand

101.37Spike high above last week's top that bulls couldn't keep
98.18Close sits right on it, so the balance point is live
95.26Liquidation low where the flush finally found a floor

The Trap

Violent swings both ways tempt the crowd to chase whichever direction the last candle broke. Then price drifts back to the middle and both sides bleed.

Last price98.19
ADR · 30 sessions3.75 pts
Daily EMA2192.49HOLD
Reopen gapNo opening gap
9293949596979899100101102close 14:30Wed 9:00close 14:30Thu 9:00close 14:30Fri 9:00close 14:30Mon 9:00close 14:30Tue 9:00close 14:30Prior week high · 99.35H1 · EMA21 · CL / MCL 98.19Yellow: 09:00 open · dashed gray: 14:30 close (ET)

The Read

Both sides took a beating. Bulls ran crude through last week's 99.35 high to 101.37, bears flushed it to 95.26 on a flood of volume, and the day closed at 98.19, almost exactly where it opened. Contract expiry likely distorted that volume, and these levels aren't matched to a specific contract, so the map deserves caution even though price still sits well above the 21-day average at 92.49. Wednesday's EIA report at 10:30 ET is the next known spark. Escape above 98.50 or below 97.87 and one side takes control; until then, nobody owns this market.

Yesterday's daily candle · Tue, Oct 20
Open98.22High101.37Low95.26Close98.19
doji · range 6.11 pts
Projected range · next session2.8 pts96.85 – 99.65
⚠ Flat / choppy conditions likely
Evidence · 10 cited findings

Price action · weekly / daily / H1

  • Daily traversed 1.63 ADR on 10.81x average volume (101.37 high to 95.26 low) yet closed at 98.19 against a 98.22 open. This signals balance and elevated reversal risk, although price stays well above the 21-day EMA at 92.49.
  • H1 stabilized near 98.19 after the sharp liquidation and rebound. Hourly ranges are below the 0.82 expansion threshold (4 bars since expansion). Directional conviction requires an escape from 97.87-98.50.
  • No gap is present into the session open (prior close 98.19).

Metrics

  • Daily volume was 10.81x the 30-day average. Nov contract expiry on Oct 20 may have distorted volume and range, so the metric is treated as low quality.
  • The final H1 range of 0.44 is below the 0.82 expansion threshold, so there is no active expansion.
  • The 98.18 weekly thesis invalidation level is 0.01 below the close, so the close is effectively on the line.

Sentiment & current events

  • Brent was about $110 on Oct 20 (range 109.04-110.97) after an Oct 19 settle of 109.55 (+1.30%). Oil is elevated near the top of its range. https://in.investing.com/commodities/brent-oil-historical-data
  • The WTI Nov contract (CLX26) expired Oct 20 after a 110.48 high. Dec (CLZ26) was about 100.12 in the Barchart snapshot, while other aggregators show front-month near 97.90-98.84. Quotes depend on contract and timestamp. https://www.barchart.com/futures/quotes/CLX26
  • The claim that oil fell on Oct 19 and pulled yields lower is CONTRADICTED by price data and is excluded.
  • Unknown: Hormuz and Saudi escalation context was not directly verified in this pass beyond price data.
Sources & evidence dates · 4
  1. in.investing.com2026-10-20
  2. barchart.com2026-10-20
  3. eia.gov
  4. Supplied claim: 'on Oct 19 the oil decline pulled US Treasury yields lower'. This is CONTRADICTED by price data: Brent rose 1.30% on Oct 19 (settle 109.55) and Nov WTI closed up 2.25 (+2.22%). Any attribution of the Oct 19 Treasury yield drop to falling oil is unsupported.2026-10-20

Free. Always. Futures trading edge in your inbox.

You're in. Watch your inbox.

We do not send junk mail. We do not spam.