The Lines in the Sand
The Trap
Breakout chasers piled in when the 03:00 hourly bar closed above 29903, and the next hour dropped 177.75 points to 29745.25. The same snap-back can catch the downside crowd near 29726.75, where the overnight low already got rejected once.
The Read
Bears dragged the week under last week's low at 29268.75, tagged 29202, and couldn't make it stick. Bulls took it back to 29893.5, and the last hour exploded into the close, parked just under the 29903 high on heavy volume. The catch is that price still sits well below a falling 21-day average at 30393.19, so this is a bounce inside a downtrend. Rising rate-hike expectations and red megacaps cut against it. Hold above 29903 and the door opens toward 30000; lose 29720 and the bounce starts to look like the trap.
Morning review · Oct 21, 7:30 AM EDT
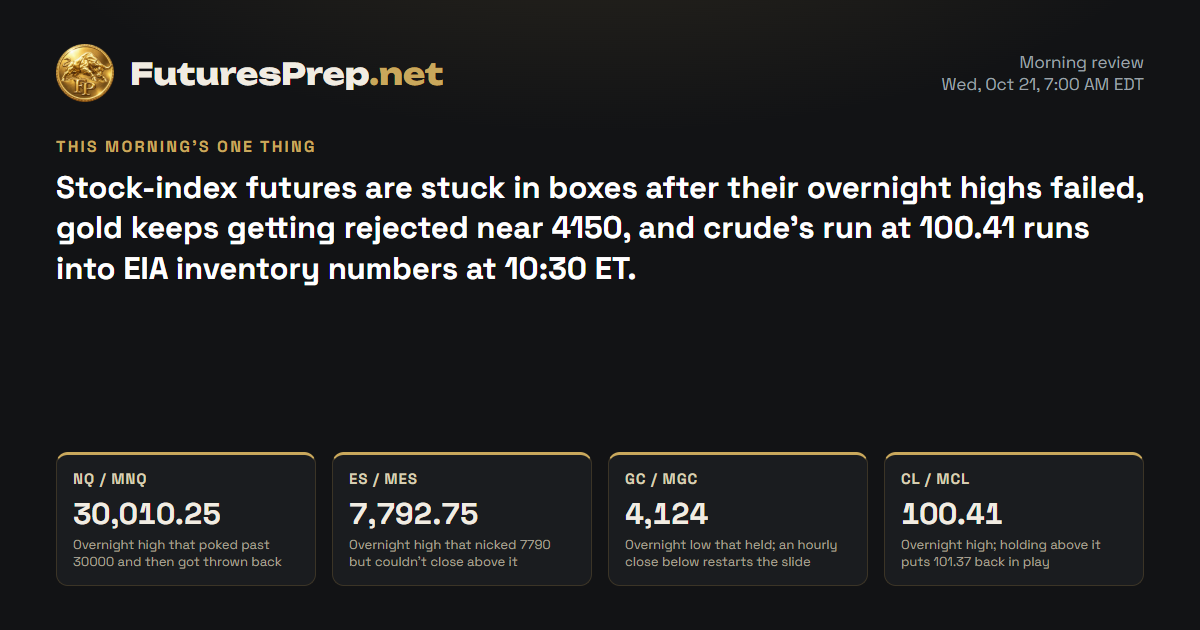
Bulls own the week and bears own the night. Price poked above 30000 to 30010.25, a 177.75-point hourly bar threw it back, and it now sits at 29820.5, right on its hourly average in the middle of the box. The weekly structure still leans up after the prior-week low at 29268.75 was swept and not accepted, but the daily is well under its 30393.19 average and the bounce has already failed once. An hourly close above 30010.25 and the door opens; an hourly close below 29725 and the floor is gone.
Overnight evidence · 5 cited findings
Overnight price action
- From the 18:30 baseline price rotated between 29726.75 and 30010.25 and ended the window at 29820.5, a net -104 from the 29924.5 open.
- The 04:00 H1 bar reversed the 03:00 close above 29903 with a 177.75-point drop to 29745.25, then price recovered to the EMA21.
Overnight events
- Premarket headlines centered on SpaceX AI-driven chip strength and Tesla merger talk. https://finnhub.io/api/news?id=b99c7f34f9d3c4158e7c9733dbdb408e295c34dd0861144baff83f87122e0473
- No scheduled data release is verified for the overnight window.
What changed
- Yesterday's bullish 58 read expected a push toward 30040 by 06:00. Price finished at 29820.5, about 220 points short, so the read is adjusted to flat.
Index drivers
| Ticker | Approx. weight | Day move | Next earnings | Top headline |
|---|---|---|---|---|
| NVDA | 8.4% | −0.29% | — | NVIDIA Launches OpenShell Reference Architecture for Safe AI Agents |
| MSFT | 5.75% | −0.31% | Oct 28 | Evergreen’s Lyra Technology Group Acquires Dutch Managed Service Provider Lantack |
| AAPL | 7.28% | −1% | Nov 2 · After close | Meta and Google are about to have a consumer AI showdown |
| AMZN | 4.04% | +0.07% | Oct 29 · After close | Ken Fisher and Jim Cramer Like This Bank Stock. Is It a Buy After Earnings? |
| META | 3.26% | −1.59% | — | Meta Platforms (NASDAQ:META): A Growth-at-a-Reasonable-Price Screen Case Study |
| AVGO | 2.47% | −0.07% | — | Top 3 Growth Stocks To Watch In October 2026 |
| GOOGL | 3% | −1.13% | Oct 28 · After close | Warren Buffett's Successor, Greg Abel, Just Went Shopping in the Tech Sector Again! |
| TSLA | 2.81% | +1.54% | — | Stock Market Today: Defensive Rally Lifts the Dow 1% as Netflix Slips After Hours and Musk Puts a SpaceX-Tesla Merger on the Table |
Most of the heavyweights closed lower on Oct 20: NVDA, MSFT, AAPL, META, GOOGL and AVGO all slipped. TSLA led the few gainers, and AMZN finished barely positive. MSFT and GOOGL post earnings Oct 28 and AMZN posts Oct 29, all outside this session.
Market data as of Oct 21, 7:33 AM EDT · Weights as of 2026-09-30
Evidence · 12 cited findings
Price action · weekly / daily / H1
- Weekly swept the prior-week low at 29268.75 (week low 29202) but did not accept below it, then recovered to 29893.5; this failed breakdown supports a green weekly close while 29202 holds.
- Daily printed a bullish reversal from 29391.25 on 1.38x average volume, but the close is still about 1.0 ADR below the falling 21-day EMA at 30393.19, so this is a countertrend recovery.
- The final H1 bar was a 212.75-point expansion closing at 29893.5, near the session high of 29903. Acceptance above 29903 favors continuation; rejection exposes 29720-29650 support.
- No gap is present into the session open (prior close 29893.5).
Metrics
- Daily volume was 1.378x the 30-day average, which supports the reversal.
- Daily range used 1.03 ADR (ADR30 497.63). The 105-point H1 expansion threshold was exceeded on the final bar.
- Engine EMA21 event is REJECT with the close 1.004 ADR below the EMA, which caps the quality of the bounce.
- Weekly arithmetic check: the 663.75-point floor needs 0.445 of the remaining ADR budget (COMFORTABLE).
Sentiment & current events
- Wells Fargo (S2) says rate-hike expectations rose on Oct 19. This hawkish backdrop opposes a clean bullish read. https://www.wellsfargoadvisors.com/research-analysis/commentary/stock-market-news.htm
- Delayed ETF data (S3, grade C) showed Nasdaq 100 +0.83% and S&P 500 +0.63% on Oct 20, consistent with the bullish daily reversal; the index levels are unreconciled with futures. https://stocksetups.com/today
- Basket drivers were mixed: NVDA -0.29%, MSFT -0.31%, AAPL -1.00%, META -1.59%, GOOGL -1.13%, TSLA +1.54% (SpaceX results and Tesla merger talk). https://finnhub.io/api/news?id=bfdab3bda91173090c726275f085298c181d3598ff667ef060dfbbe3ac5e2c18
- Breadth headline: the rally is broadening beyond Big Tech. https://finnhub.io/api/news?id=01d44bae4113a6f983cb1fa1539024539ab713f271a6ee4d6cadae9e501d1b5a
Sources & evidence dates · 26
- stocksetups.com2026-10-20
- Wells Fargo's Oct 20 opening comment says market expectations for Fed rate hikes rose on Oct 19, and Fed officials (Waller, Oct 8) have said more hikes may be needed. This is a hawkish backdrop that conflicts with a clean bullish equity and gold-neutral read. Housing starts, pending home sales and building permits were due Oct 20.2026-10-20
- Supplied claim: 'on Oct 19 the oil decline pulled US Treasury yields lower'. This is CONTRADICTED by price data: Brent rose 1.30% on Oct 19 (settle 109.55) and Nov WTI closed up 2.25 (+2.22%). Any attribution of the Oct 19 Treasury yield drop to falling oil is unsupported.2026-10-20
- flashalpha.com2026-10-02
- Yahoo2026-10-21T09:48:00.000Z
- Yahoo2026-10-21T09:45:00.000Z
- Yahoo2026-10-21T09:35:00.000Z
- Yahoo2026-10-21T10:00:00.000Z
- Yahoo2026-10-21T09:12:00.000Z
- Yahoo2026-10-21T10:00:00.000Z
- Yahoo2026-10-21T08:54:19.000Z
- Yahoo2026-10-21T06:12:00.000Z
- Yahoo2026-10-21T09:46:22.000Z
- Yahoo2026-10-21T09:33:00.000Z
- Yahoo2026-10-21T08:15:00.000Z
- ChartMill2026-10-21T10:50:47.000Z
- Yahoo2026-10-21T09:28:07.000Z
- Yahoo2026-10-21T09:26:11.000Z
- Yahoo2026-10-21T05:15:51.000Z
- Yahoo2026-10-21T02:03:00.000Z
- Yahoo2026-10-20T23:13:12.000Z
- Yahoo2026-10-21T09:26:02.000Z
- Yahoo2026-10-21T09:08:00.000Z
- ChartMill2026-10-21T11:09:33.000Z
- Yahoo2026-10-21T08:58:51.000Z
- Yahoo2026-10-21T08:41:06.000Z