Session Prep

Two minutes tonight. A plan tomorrow.
Morning review · Data as of Tue, Oct 20, 7:00 AM EDT · All times Eastern
Deep research

This morning's one thing

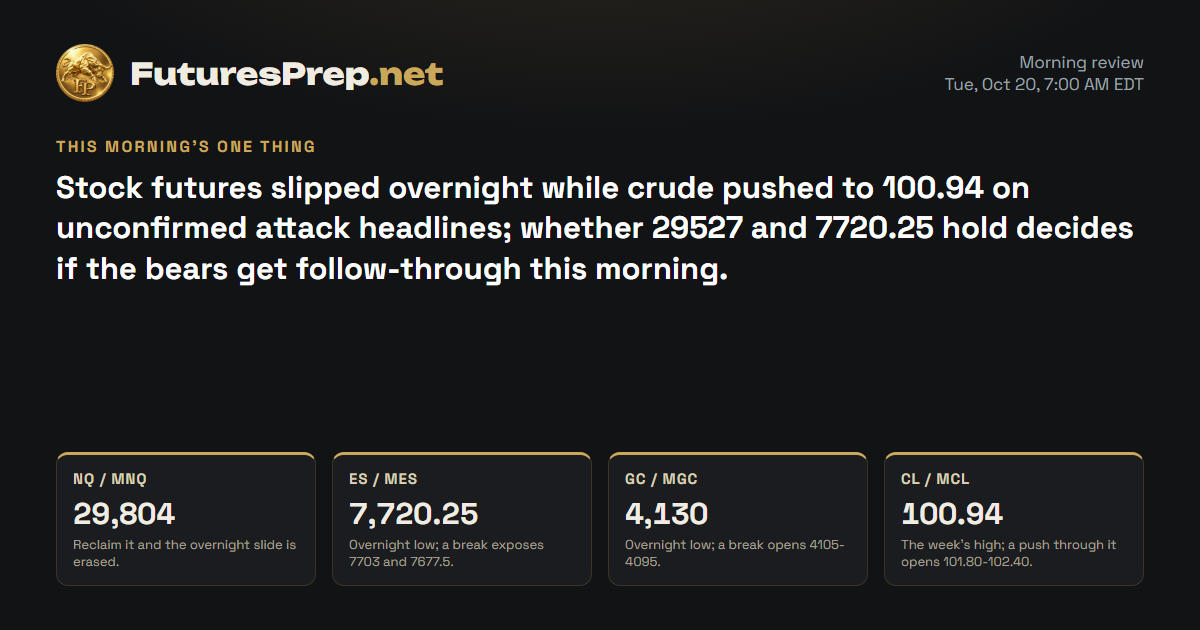
Stock futures slipped overnight while crude pushed to 100.94 on unconfirmed attack headlines; whether 29527 and 7720.25 hold decides if the bears get follow-through this morning.

Today's market movers · Tuesday, October 20

No major U.S. releases or tracked driver earnings scheduled.

U.S. releases, high and medium impact.

NQ / MNQE-mini / Micro E-mini Nasdaq-100Weekly thesis · STRESSED

The Lines in the Sand

29,804Reclaim it and the overnight slide is erased.
29,527Overnight floor; a crack opens the slide lower.
29,229.75Weekly open, the bulls' last claim on the week.

The Trap

Late bears tend to press a 29527 break into a week that already swept last week's low and bounced, and that is where they get squeezed. On the other side, bulls who treat the Nvidia order chatter as fuel are leaning on a story that index futures have not reacted to.

Last price29,581.5
ADR · 30 sessions491.87 pts
Daily EMA2130,442.87BELOW
Reopen gapNo opening gap
29,20029,40029,60029,80030,00030,20030,40030,60030,80031,000Tue 9:30close 16:00Wed 9:30close 16:00Thu 9:30close 16:00Fri 9:30close 16:00Mon 9:30close 16:00Prior week low · 29,268.75H1 · EMA21 · NQ / MNQ 29,581.5Dashed: last night's path
Overnight: invalidated

The Read

INVALIDATED

Shorts pressed last week's break and got caught: price swept the prior-week low at 29268.75, tagged 29202, and ripped to 29983.25 before fading into a 29744 close. That is a failed breakdown on above-average volume, and it left the bears offside. The catch is overhead: the daily EMA21 sits way up at 30442.87, the session range was already stretched, and the close slipped back under the hourly average, so this is still a bounce inside a falling structure. Hold 29650 and the door to 29983.25 stays open, with 30000 the line that would retire last week's bearish picture; lose 29650 and the floor drops toward 29450-29202.

Morning review · Oct 20, 7:30 AM EDT

Bears have run the overnight session. Price has made lower highs off 29803.5, every hourly close since 03:00 sits under 29650, and bulls who leaned on Monday's rally are offside after the 29983.25 high was turned away. The strongest counter is that overnight index quotes show only a mild dip, not a rout, and the week still holds above its 29229.75 open, which leaves bulls a thin claim. Lose 29527 and the floor gives way toward the 29390-29270 shelf; reclaim 29804 and the bulls are back in the fight.

Overnight evidence · 8 cited findings

Overnight price action

  • Window 2026-10-19T18:30 to 2026-10-20T07:30 ET: high 29803.5, low 29527, range 0.56 ADR, net -162.75 points from the evening baseline (29744). Only one H1 boundary is approximated.
  • The high came early in the session. After that, price made lower closes in the 20:00, 00:00, 01:00, 03:00 and 06:00 bars, with a failed bounce to 29738.75 in the 02:00 bar.
  • The low of 29527 printed in the 05:00 bar, 325 points above the week low (29202), so the weekly sweep zone is untested overnight.

Overnight events

  • No verified overnight catalyst. Premarket Nasdaq futures were reported lower (https://finnhub.io/api/news?id=6d2650f866af755c83c911906ac09edb4ebf193aecd145322043386e7602305a), while Business Insider and Yahoo show only -0.18% to -0.29%.
  • The Nvidia chip-order chatter and the Google Cloud outage appeared overnight but have no verified index effect.

What changed

  • Net versus the evening read: the bullish path (hold 29650, retest 29983) failed overnight. The evening expected path had 29805 at 05:00; the 05:00 bar closed at 29622.25.
  • The overnight slide supports the price action bearish read, but it neither confirms nor kills the RED week thesis, which needs a 30000 close to be retired.
  • Verdict INVALIDATED: the direction changes from the evening's bullish to price action's bearish.
Yesterday's daily candle · Mon, Oct 19
Open29,229.75High29,983.25Low29,202Close29,744
bullish · range 781.25 pts
Projected range · next session480 pts29,585 – 30,065

Index drivers

Most heavyweights finished Monday higher: Amazon and Tesla led, with Nvidia, Broadcom, Alphabet and Microsoft also up, while Apple and Meta slipped. None of the listed heavyweights reports today. Microsoft and Alphabet report on 10/28, Amazon on 10/29 after the close, and Apple on 11/02 after the close.

Market data as of Oct 20, 7:34 AM EDT · Weights as of 2026-09-30

Evidence · 13 cited findings

Price action · weekly / daily / H1

  • Weekly: price swept the prior-week low at 29268.75 (week low 29202) but did not accept below it. It closed Monday at 29744, 475.25 points above that level and 514.25 above the week open of 29229.75. The prior-week range is 29268.75-31290, so this is a failed breakdown inside a still-lower range.
  • Daily: a bullish candle (O 29229.75, H 29983.25, L 29202, C 29744) on 1.41x average volume. The close is 1.42 ADR below the daily EMA21 (30442.87) and the engine tags the EMA21 event as REJECT, so the bounce is corrective until the EMA is reclaimed.
  • Range used was 1.59x the ADR of 491.87, so Monday's range was already stretched for a single session. That limits clean continuation from the open.
  • H1: recovery from 29202 to a 29983.25 high at 11:00, then a fade into a tight 29701-29755 close bar. The last close of 29744 sits just below the H1 EMA21 (29762.76). While 29650 holds, a retest of 29983 is favored. A close below 29650 exposes 29450-29202.
  • Scenario path: 29710 (22:00) to 29805 (05:00) to 29960 (10:00) to 29885 (16:00). This is a projection, not an observation.

Metrics

  • The daily EMA21 is 30442.87 and the close is 1.42 ADR below it. This is the main metric drag on the bullish read: structure is still below trend.
  • Volume on the bullish day was 1.41x the 30-day average and the body was 1.05 ADR. That is real participation behind the bounce, but the close was off the 29983.25 high.
  • H1 expansion threshold is 105 points; the last bar was 54.5 and the market is not expanding. Top historical expansion hours are 10, 9 and 11 ET, matching the 09:00-12:00 window.
  • Sunday thesis (RED, v1, declared 2026-10-18T12:00:02-04:00) is STRESSED with flags TOOK_PRIOR_LOW_NOT_ACCEPTED and OVERSHOOT_BEYOND_DECLARED_ZONE. Price is below the 30000 invalidation and has not closed through it. The 514.25-point arithmetic floor is COMFORTABLE (feasibility 0.26).

Sentiment & current events

  • Monday relief rally: Yahoo/Finnhub reports the tech-heavy Nasdaq led Wall Street ahead of key earnings (https://finnhub.io/api/news?id=a139c8e472ae6059b9be8564cf6efbe69069460e8698377098c7300a062d83a7). Heavyweights closed higher: AMZN +4.98% (262.45), NVDA +1.38%, GOOGL +1.05%, MSFT +0.84%, TSLA +3.76%. AAPL -0.15% and META -0.55% were the exceptions.
  • Headline 'The AI Trade Is Working Again' (https://finnhub.io/api/news?id=16acd05f61b2b0e02e9f1208d35f869137e32f346833912111e3fa64da57c162). This is supportive but headline-level, and a one-day snapback after Friday's selloff.
  • Friday 10/16: Nasdaq 100 -2.5% to a 1-month low as crude rose more than 3% (Barchart https://www.barchart.com/futures/quotes/VI*0). This is verified but older than one session, so it is context only.
  • Macro overhang: September CPI +0.6% m/m and 3.7% y/y, core 2.6% y/y (BLS https://www.bls.gov/news.release/cpi.nr0.htm); payrolls +29k (https://www.bls.gov/news.release/empsit.nr0.htm). Both are verified but flagged old by the engine.
Sources & evidence dates · 29
  1. bls.gov2026-10-14
  2. Sept payrolls +29,000, unemployment 4.2%. Confirmed on the BLS release dated 10/2. The 4.1% prior rate, hourly earnings (0.1% m/m, 3.0% y/y) and the 60k combined downward revisions were not visible in the truncated text.2026-10-02
  3. barchart.com2026-10-16
  4. finance.yahoo.com2026-10-19
  5. centralbank.watch2026-10-16
  6. kiplinger.com2026-10-16
  7. TradingView NQ levels (31,616.50, 28,978.25, about 31.3k) and the sector-zero MNQ ranges are S4 or promotional and undated. They are never directional evidence. The roughly 31k NQ levels also conflict with price action's MNQ levels (29,200-30,000).
  8. Yahoo2026-10-20T09:48:00.000Z
  9. Yahoo2026-10-20T09:46:40.000Z
  10. Yahoo2026-10-20T09:35:00.000Z
  11. Yahoo2026-10-20T07:10:57.000Z
  12. SeekingAlpha2026-10-20T06:43:37.000Z
  13. Yahoo2026-10-20T04:10:02.000Z
  14. Yahoo2026-10-20T00:41:00.000Z
  15. Yahoo2026-10-19T23:50:00.000Z
  16. Yahoo2026-10-19T23:17:00.000Z
  17. Yahoo2026-10-20T08:13:57.000Z
  18. Yahoo2026-10-20T07:00:00.000Z
  19. Yahoo2026-10-20T06:25:00.000Z
  20. Yahoo2026-10-20T08:52:01.000Z
  21. Yahoo2026-10-20T08:04:14.000Z
  22. Yahoo2026-10-20T07:40:49.000Z
  23. Yahoo2026-10-20T09:08:01.000Z
  24. Yahoo2026-10-20T03:08:22.000Z
  25. Yahoo2026-10-20T01:20:56.000Z
  26. Yahoo2026-10-20T09:17:49.000Z
  27. Yahoo2026-10-20T09:17:05.000Z
  28. Yahoo2026-10-20T08:46:00.000Z
  29. Yahoo2026-10-20T08:18:20.000Z
ES / MESE-mini / Micro E-mini S&P 500Weekly thesis · STRESSED

The Lines in the Sand

7,720.25Overnight low; a break exposes 7703 and 7677.5.
7,752.75Reclaim it and the downside break goes stale.
7,773.25Monday's high, which the bulls never turned into acceptance.

The Trap

A one-point slip under 7727 can look like a breakdown, but it has no follow-through yet. Bears who press it into flat overnight futures tend to get caught if price snaps back above 7752.75.

Last price7,726
ADR · 30 sessions78.83 pts
Daily EMA217,784.15BELOW
Reopen gapNo opening gap
7,6757,7007,7257,7507,7757,8007,8257,8507,875Tue 9:30close 16:00Wed 9:30close 16:00Thu 9:30close 16:00Fri 9:30close 16:00Mon 9:30close 16:00Prior week high · 7,887Prior week low · 7,676H1 · EMA21 · ES / MES 7,726Dashed: last night's path
Overnight: invalidated

The Read

INVALIDATED

Bulls defended the basement: the week opened at 7679, dipped to 7677.5 just above the prior-week low of 7676, and climbed to 7773.25 before fading to a 7740.25 close. The bounce was real but softer than the Nasdaq's, and the daily EMA21 at 7784.15 still caps it as overhead supply. Conflicting oil headlines are the wildcard, since one Monday wrap had higher crude dragging the Dow. Hold 7727 and a retest of 7773.25 is on the table, with a close above 7790 flipping last week's bearish picture; accept below 7727 and 7677.5 comes back into view.

Morning review · Oct 20, 7:30 AM EDT

Bears nudged price under 7727 at 06:00, but only by a point, so the break is barely there. The tape leans their way, with overnight lower highs and closes beneath a falling hourly average, but S&P futures are flat overnight, and that is the strongest argument against them. Bulls still hold the week above the 7679 open, and price sits inside last week's range. Lose 7720.25 and the path toward 7703 opens; reclaim 7752.75 and the break goes stale, with 7773.25 as the door to more.

Overnight evidence · 8 cited findings

Overnight price action

  • Window 2026-10-19T18:30 to 2026-10-20T07:30 ET: high 7752.75, low 7720.25, range 0.41 ADR, net -15 points from the evening baseline (7740.25).
  • Price made lower highs through the night: 7752.25 at 02:00, then 7749.25, 7745.25 and 7736.5. The low of 7720.25 printed in the 05:00 bar.
  • The last H1 close of 7726 is one point under the 7727 flip level, and the 05:00 close was 7731.25.

Overnight events

  • No verified overnight catalyst. Futures are reported flat (Yahoo -0.02%, Business Insider +0.07%) while the Nasdaq complex is slightly lower.
  • The premarket weakness appears concentrated in tech and semiconductors (https://finnhub.io/api/news?id=9a17dc6fa09eb568c65ed0faf70effc7e046117e52f7cb9a105aa00bd4b2ec66).

What changed

  • Net versus the evening read: the bullish path (hold 7727, retest 7773) failed marginally. The evening path had 7750 at 05:00; the 05:00 bar closed at 7731.25.
  • The breach is thin, and flat futures mean the verdict is less secure than for MNQ.
  • Verdict INVALIDATED: direction changes from the evening's bullish to price action's bearish.
Yesterday's daily candle · Mon, Oct 19
Open7,679High7,773.25Low7,677.5Close7,740.25
bullish · range 95.75 pts
Projected range · next session72 pts7,718.5 – 7,790.5

Index drivers

Monday's heavyweight strength was broad: Amazon, Tesla and Micron led, with Nvidia, Broadcom, AMD, Alphabet and Microsoft also higher. Apple and Meta slipped, and Berkshire was flat. None of the listed heavyweights reports today. Microsoft and Alphabet report on 10/28, Amazon on 10/29, Apple on 11/02 and AMD on 11/03.

Market data as of Oct 20, 7:34 AM EDT · Weights as of 2026-10-01

Evidence · 14 cited findings

Price action · weekly / daily / H1

  • Weekly: the open of 7679 and low of 7677.5 held just above the prior-week low of 7676, and the week closed at 7740.25, 37.25 above the prior-week close of 7703. The prior-week range of 7676-7887 is intact, with neither side broken.
  • Daily: a 61.25-point bullish body (O 7679, H 7773.25, L 7677.5, C 7740.25) on 1.25x average volume. The close is 0.56 ADR below the daily EMA21 (7784.15) and the event is a REJECT, so overhead supply is intact.
  • Range used was 1.22x the ADR of 78.83, so Monday was stretched.
  • H1: peak at 7773.25 at 11:00, then a fade. The last close of 7740.25 is below the H1 EMA21 (7746.51), with a tight 7732.25-7740.75 final bar. Support at 7727-7732 supports a retest of 7773, while acceptance below 7727 weakens the rebound.
  • Scenario path: 7736 (22:00) to 7750 (05:00) to 7772 (10:00) to 7763 (16:00). This is a projection, not an observation.

Metrics

  • The daily EMA21 is 7784.15, 43.9 points above the close. The distance is only 0.56 ADR, much closer than MNQ, so a reclaim is more achievable.
  • Volume was 1.25x average and the body was 0.78 ADR: a moderate bounce, weaker than the NQ response.
  • H1 expansion threshold is 18.5 points; the last bar was 8.5 and the market is not expanding. Top expansion hours are 10, 11 and 9 ET.
  • Sunday thesis RED (invalidation 7790, overshoot zone 7588-7624, expected extreme Tuesday NY-AM) is STRESSED with flag OVERSHOOT_BEYOND_DECLARED_ZONE. The 61.25-point floor is COMFORTABLE (feasibility 0.19).

Sentiment & current events

  • Monday relief rally led by the Nasdaq (https://finnhub.io/api/news?id=a139c8e472ae6059b9be8564cf6efbe69069460e8698377098c7300a062d83a7). SPY drivers closed mostly higher: AMZN +4.98%, MU +2.97%, NVDA +1.38%, AMD +1.76%, GOOG +0.96%. AAPL and META were slightly negative.
  • Headline 'Stock Market Today: Dow Dips As Oil Jumps, Nasdaq Pops' (https://finnhub.io/api/news?id=c88344c89e5ede3a8a47ebcd44e909b160fca4cb73c840f8b3251ecf5bf6ab25). Barchart has WTI down about 0.6% on Monday; the oil direction is unresolved across sources, and a Dow dip on higher oil would weigh on the S&P.
  • Friday 10/16: S&P 500 -1.09% to a 2-week low as crude rose more than 3% (Barchart https://www.barchart.com/futures/quotes/VI*0). Verified but older than one session.
  • September CPI +0.6% m/m and core 2.6% y/y (BLS https://www.bls.gov/news.release/cpi.nr0.htm) and payrolls +29k (https://www.bls.gov/news.release/empsit.nr0.htm). Verified and held as background.
  • Meta and Tesla report after the close on 10/21, a risk for the later week rather than the next 12 hours.
Sources & evidence dates · 36
  1. bls.gov2026-10-14
  2. Sept payrolls +29,000, unemployment 4.2%. Confirmed on the BLS release dated 10/2. The 4.1% prior rate, hourly earnings (0.1% m/m, 3.0% y/y) and the 60k combined downward revisions were not visible in the truncated text.2026-10-02
  3. barchart.com2026-10-16
  4. finance.yahoo.com2026-10-19
  5. A tickerdaily.com page claims the S&P 500 closed at 5,847 on 10/19 with the Nasdaq -0.18% and the Dow +0.61%. The S&P level is irreconcilable with the Barchart-reported 10/16 move and with the S&P near 7,659 elsewhere. It is S4 and must not be used as evidence.2026-10-19
  6. centralbank.watch2026-10-16
  7. kiplinger.com2026-10-16
  8. Yahoo2026-10-20T09:48:00.000Z
  9. Yahoo2026-10-20T09:46:40.000Z
  10. Yahoo2026-10-20T09:35:00.000Z
  11. Yahoo2026-10-20T07:10:57.000Z
  12. SeekingAlpha2026-10-20T06:43:37.000Z
  13. Yahoo2026-10-20T04:10:02.000Z
  14. Yahoo2026-10-20T00:41:00.000Z
  15. Yahoo2026-10-19T23:50:00.000Z
  16. Yahoo2026-10-19T23:17:00.000Z
  17. Yahoo2026-10-20T08:13:57.000Z
  18. Yahoo2026-10-20T07:00:00.000Z
  19. Yahoo2026-10-20T06:25:00.000Z
  20. Yahoo2026-10-20T08:52:01.000Z
  21. Yahoo2026-10-20T08:04:14.000Z
  22. Yahoo2026-10-20T07:40:49.000Z
  23. Yahoo2026-10-20T09:08:01.000Z
  24. Yahoo2026-10-20T03:08:22.000Z
  25. Yahoo2026-10-20T01:20:56.000Z
  26. Yahoo2026-10-20T09:17:49.000Z
  27. Yahoo2026-10-20T09:17:05.000Z
  28. Yahoo2026-10-20T08:46:00.000Z
  29. Yahoo2026-10-20T08:18:20.000Z
  30. Yahoo2026-10-20T08:41:02.000Z
  31. Yahoo2026-10-20T08:37:50.000Z
  32. Yahoo2026-10-20T08:29:00.000Z
  33. Yahoo2026-10-20T08:15:01.000Z
  34. Yahoo2026-10-19T23:00:00.000Z
  35. Yahoo2026-10-19T21:41:20.000Z
  36. Yahoo2026-10-19T21:05:01.000Z
GC / MGCGold / Micro GoldWeekly thesis · INTACT

The Lines in the Sand

4,130Overnight low; a break opens 4105-4095.
4,166.4The bounce stalled under it; a reclaim loosens the bears' grip.
4,211.2The week's high; acceptance above it ends the bear case.

The Trap

The pressure so far has been a slow drift on light volume, not a panic. Late bears who chase a flush under 4130, which sits only about 9 points away, can get squeezed back into the range when a drift like that runs out of steam.

Last price4,139.6
ADR · 30 sessions84.74 pts
Daily EMA214,224.33BELOW
Reopen gapNo opening gap
4,1004,1204,1404,1604,1804,2004,220Tue 8:20close 13:30Wed 8:20close 13:30Thu 8:20close 13:30Fri 8:20close 13:30Mon 8:20close 13:30Prior week low · 4,094.8H1 · EMA21 · GC / MGC 4,139.6Dashed: last night's path
Overnight: held

The Read

Bulls had the overnight session and lost it: gold peaked at 4211.2 early, then slid steadily to a 4160.2 close below both its daily and hourly averages. Nobody panicked, though; volume was light and the last hourly bars squeezed down to almost nothing just above 4155.5. That coil is the tell, and the light volume is also the strongest case against the bears, because thin drops can snap back. A close below 4155.5 opens the trapdoor toward 4125-4100; reclaim 4182 and the slide is interrupted, while 4211.2 back in hand puts the bulls in charge.

Morning review · Oct 20, 7:30 AM EDT

Bears have pressed gold all night, with lower highs, lower lows and closes under a falling hourly average. The bounce off 4130 stalled before 4166.4, and the week sits 45.5 points under its 4185.1 open. Crack 4130 and the path toward 4105-4095 opens; reclaim 4166.4 and the bears lose their grip, with 4211.2 as the line that would flip the week.

Overnight evidence · 7 cited findings

Overnight price action

  • Window 2026-10-19T18:30 to 2026-10-20T07:30 ET: high 4166.4, low 4130, range 0.43 ADR, net -20.9 points from the evening baseline (4160.2).
  • The 01:00 bar dropped from 4162.9 to 4138.5, and the 05:00 bar printed the 4130 low. Later bars held 4130-4145 with a small rebound to a 4139.6 close.
  • The evening path expected 4152 at 05:00 and 4128 at 10:00. Price reached that area earlier than projected.

Overnight events

  • No verified overnight catalyst. Gold futures are lower (Barchart GCZ26 -0.51%, https://www.barchart.com/futures/quotes/GC*0/futures-prices).

What changed

  • Net versus the evening read: confirmed. The 4155.5 trigger broke and price is ahead of the evening path.
  • The overnight low of 4130 now sits at the price action trigger, so the next test is whether a close below 4130 follows.
  • Verdict unchanged: direction, trigger and weekly read all match the evening read.
Yesterday's daily candle · Mon, Oct 19
Open4,185.1High4,211.2Low4,155.6Close4,160.2
bearish · range 55.6 pts
Projected range · next session63 pts4,118.5 – 4,181.5
Evidence · 12 cited findings

Price action · weekly / daily / H1

  • Weekly: the open of 4185.1 was near the prior-week close of 4186.5, the high of 4211.2 stayed below the prior-week high of 4242.3, and the week closed red at 4160.2. The prior-week low of 4094.8 is the main lower reference.
  • Daily: a bearish body (O 4185.1, H 4211.2, L 4155.6, C 4160.2) closing near the lower edge of its range. It is a REJECT, 0.76 ADR below the daily EMA21 (4224.33), on only 0.69x average volume. That supports downside continuation, not capitulation.
  • H1: a steady decline from the 4211.2 high at 03:00 into compression at 4155.6-4169.2, below a falling H1 EMA21 (4176.75). The last bars were only 5.1 points wide. Compression near support followed by a close below 4155.5 favors expansion toward 4125-4100; recovery above 4182 would interrupt the bearish sequence.
  • Range used was 0.66x the ADR of 84.74, so there is room left for expansion in the session.
  • Scenario path: 4166 (22:00) to 4152 (05:00) to 4128 (10:00) to 4140 (16:00). This is a projection, not an observation.

Metrics

  • The close is below the daily EMA21 (0.76 ADR) and below the falling H1 EMA21, a consistent bearish trend read.
  • Volume was only 0.69x average and the body was 0.29 ADR, so the selling lacked force. This limits conviction in a clean breakdown.
  • H1 expansion threshold is 23.9 points and the last bar was 5.1; barsSinceExpansion is 7, so a compressed market is pending expansion. Top expansion hours are 10, 9 and 21 ET.
  • The Sunday thesis was flat (invalidation 4220.5, overshoot zone 4128-4167.5, expected extreme Monday NY-AM) and is INTACT with no flags. The price is inside its overshoot zone. The 16.56-point floor is COMFORTABLE (feasibility 0.05).

Sentiment & current events

  • Gold was range-bound at 4,140-4,216 per CME on 10/12 (https://www.cmegroup.com/rss/metals-video-commentary.rss). The current 4,160 sits inside that range and was not re-quoted for 10/19, so a break of 4155.5 is a near-floor test.
  • Macro: September CPI +0.6% m/m, 3.7% y/y (https://www.bls.gov/news.release/cpi.nr0.htm) and weak payrolls of +29k (https://www.bls.gov/news.release/empsit.nr0.htm). Both are verified, flagged old, and cut both ways for gold.
  • No verified gold-specific catalyst or fresh 10/19 settlement was retrieved. Gold-specific sentiment is UNKNOWN.
Sources & evidence dates · 5
  1. bls.gov2026-10-14
  2. Sept payrolls +29,000, unemployment 4.2%. Confirmed on the BLS release dated 10/2. The 4.1% prior rate, hourly earnings (0.1% m/m, 3.0% y/y) and the 60k combined downward revisions were not visible in the truncated text.2026-10-02
  3. centralbank.watch2026-10-16
  4. kiplinger.com2026-10-16
  5. Gold is range-bound at 4,140-4,216 per CME (10/12). price action's MGC levels (about 4,160, with 4,155.5 as the trigger) sit inside that range, so a 4,155.5 breakdown would be a near-floor test. Gold futures were not re-quoted for 10/19.2026-10-12
CL / MCLWTI Crude Oil / Micro WTI Crude OilWeekly thesis · FULFILLED

The Lines in the Sand

100.94The week's high; a push through it opens 101.80-102.40.
99.5Slip back under it and the breakout becomes a stall.
99.35Last week's high, taken but not yet accepted.

The Trap

Fading strength too early has already hurt: bears who leaned on the evening rejection got run over above 99.35. The opposite trap is chasing a stretched spike built on unconfirmed attack headlines, which can leave late bulls offside fast if those reports are walked back.

Last price100.56
ADR · 30 sessions3.63 pts
Daily EMA2191.92ABOVE
Reopen gapNo opening gap
92949698100Tue 9:00close 14:30Wed 9:00close 14:30Thu 9:00close 14:30Fri 9:00close 14:30Mon 9:00close 14:30Prior week high · 99.35H1 · EMA21 · CL / MCL 100.56Dashed: last night's path
Overnight: invalidated

The Read

INVALIDATED

Breakout bulls pushed crude through last week's high at 99.35 to 99.73 and got slapped back, closing at 98.23. That is a rejection, but the bigger trend still points up, with price well above the daily EMA21 at 91.92 after a run from 88.91. Sources disagree on whether oil finished Monday higher or lower, and the huge volume print may be roll noise rather than real distribution. An hourly close below 97.90 puts 97.10-96.73 back in play; an hourly close back above 99.35 erases the rejection and hands the tape back to the bulls.

Morning review · Oct 20, 7:30 AM EDT

Bulls ran crude through last week's 99.35 high overnight and pinned it near 100.94, which left bears who leaned on the evening rejection offside. Volume is heavy, and that is the strongest case that the move is real. Even so, the fuel is shaky: Saudi attack claims nobody has confirmed, and a thin, expiring November contract whose premium may fade. Price is stretched far above its daily trend average, which is where rallies tend to run out of breath. Hold above 100.94 and the door opens toward 101.80-102.40; lose 99.50 and the breakout turns into a stall.

Overnight evidence · 6 cited findings

Overnight price action

  • Window 2026-10-19T18:30 to 2026-10-20T07:30 ET: high 100.94, low 98.01, range 0.81 ADR, net +2.34 from the evening baseline (98.23).
  • A stair-step advance: 99.49 (01:00), 99.43 (03:00), 100.31 (04:00), 100.53 (05:00), 100.56 (06:00). The 02:00 bar spiked to 99.80 and gave back to 98.47 before the advance resumed.
  • Hourly closes crossed the evening invalidation (99.35) from the 03:00 bar and held. The engine reports crossedInvalidation true for the Sunday bullish weekly view level as well, which is consistent with its FULFILLED state.

What changed

  • Net versus the evening read: opposite. The evening path expected 98.05 at 05:00; the 05:00 bar closed at 100.53, so price ran about 2.5 points above the projected path.
  • The rejection below 99.35-99.73 that carried the bearish read did not hold, and the weekly bar now closes at a new high.
  • Verdict INVALIDATED: direction changes from the evening's bearish to price action's bullish, with the contract-series caveat unresolved.
Yesterday's daily candle · Mon, Oct 19
Open99.07High99.73Low96.73Close98.23
bearish · range 3 pts
Projected range · next session2.2 pts96.85 – 99.05
Evidence · 12 cited findings

Price action · weekly / daily / H1

  • Weekly: price swept the prior-week high at 99.35 (week high 99.73) without accepting above it. The week closed at 98.23, below the 99.07 open and prior-week close, a bearish rejection inside a multi-day advance from the prior-week low of 88.91.
  • Daily: a bearish candle (O 99.07, H 99.73, L 96.73, C 98.23) with a modest body. Close is still 1.74 ADR above the daily EMA21 (91.92), so the broader trend stays up. Range used was 0.83x the ADR of 3.63.
  • H1: a recovery from 96.73 (03:00) to a 99.73 spike at 13:00, then a sharp reversal to 98.08 and a stall at 98.2-98.55. The last close of 98.23 sits just above the H1 EMA21 (97.94). Acceptance below 97.90 favors a retest of 97.10-96.73; a close above 99.35 would invalidate the immediate bearish rejection.
  • Scenario path: 98.42 (22:00) to 98.05 (05:00) to 97.25 (10:00) to 97.55 (16:00). This is a projection, not an observation.

Metrics

  • The close is 1.74 ADR above the daily EMA21 and the event is HOLD, the largest metric opposition to the bearish read: trend is up, the read rests on rejection only.
  • Daily volume is 9.43x the 30-day average. The engine volume figure is extreme and the data caution is that it may reflect contract-roll or thin-average effects, so it is treated as an exhaustion or distribution warning rather than proof.
  • H1 expansion threshold is 0.82 and the last bar was 0.27; barsSinceExpansion is 2. Top expansion hours are 10, 9 and 11 ET.
  • Sunday thesis GREEN (invalidation 98.18, overshoot zone 101.6-103.4, expected extreme Tuesday NY-AM) is STRESSED with flags TOOK_PRIOR_HIGH_NOT_ACCEPTED and OVERSHOOT_BEYOND_DECLARED_ZONE. The close of 98.23 is only 0.05 above the 98.18 invalidation, so a modest down move would retire it.

Sentiment & current events

  • Barchart: Nov WTI closed +3.51% on Fri 10/16 at a 1-month high, then was down about 0.6% on Monday; Dec WTI was 98.44 intraday (prior close 99.02, high 99.71) (https://www.barchart.com/futures/quotes/CL*0). The page cites Persian Gulf flows back to about 80% of pre-war levels per the US Energy Secretary (second-hand), with refined products still constrained. This is the supportive eligible evidence for the fade.
  • A Yahoo/Finnhub headline says 'Dow Dips As Oil Jumps' on Monday (https://finnhub.io/api/news?id=c88344c89e5ede3a8a47ebcd44e909b160fca4cb73c840f8b3251ecf5bf6ab25), which conflicts with the Barchart read of a lower Monday settle. Unresolved.
  • The commodity-board claim of WTI above $100 is contradicted by the Barchart quotes and excluded. The Brent figure was not checked.
  • September CPI showed gasoline +9.1% m/m and energy +20.4% y/y (https://www.bls.gov/news.release/cpi.nr0.htm). Verified but old; it frames an elevated energy backdrop, not a Tuesday catalyst.
Sources & evidence dates · 5
  1. bls.gov2026-10-14
  2. Barchart: Nov WTI (CLX26) closed +3.44 (+3.51%) on Fri 10/16, a 1-month high. On Mon 10/19 it was down about 0.6%, and Dec WTI (CLZ26) was 98.44 at 13:46 CT. Prior close 99.02, day high 99.71. This is consistent with price action's MCL levels (high 99.73, close area about 98.2, prior settle about 99.07). The same page says Persian Gulf flows are back to about 80% of pre-war levels per the US Energy Secretary, with refined products still constrained.2026-10-19
  3. Supplied commodity-board claim that WTI is above $100 and Brent above $110 on 10/19 conflicts with exchange-derived Barchart quotes: Dec WTI 98.44 intraday, Nov WTI about 98, high 99.71. The WTI-above-$100 part is contradicted for 10/19. The Brent figure was not checked.2026-10-19
  4. centralbank.watch2026-10-16
  5. kiplinger.com2026-10-16

Free. Always. Futures trading edge in your inbox.

You're in. Watch your inbox.

We do not send junk mail. We do not spam.