Session Prep

Two minutes tonight. A plan tomorrow.
Evening edition · Data as of Fri, Oct 16, 5:00 PM EDT · All times Eastern
Deep research

Tonight's one thing

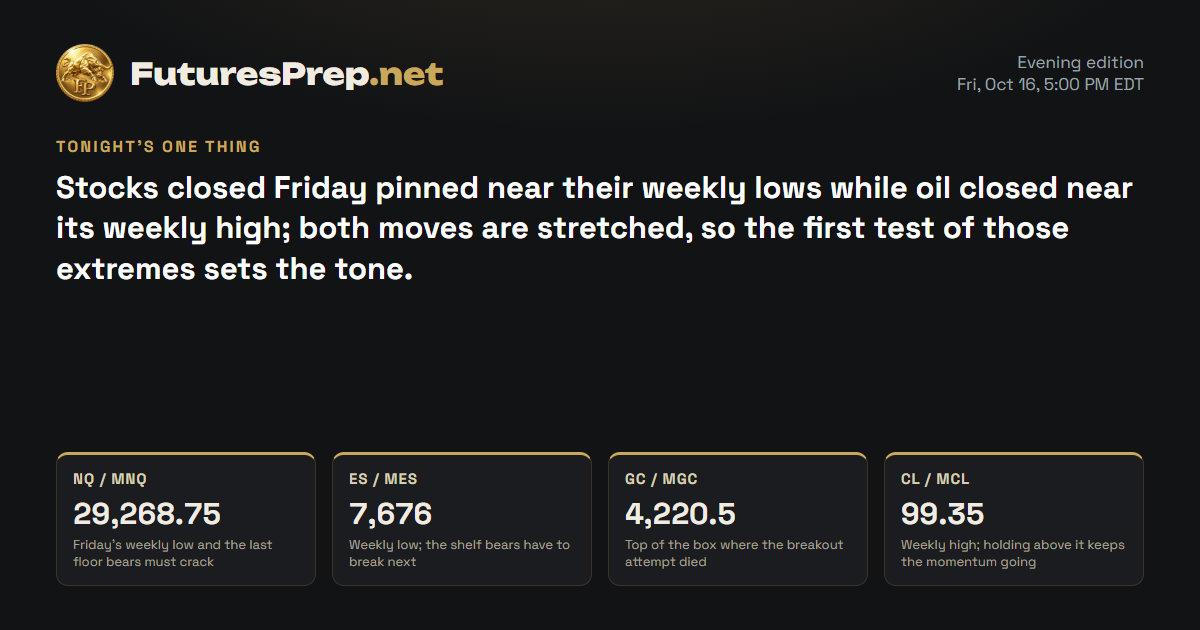
Stocks closed Friday pinned near their weekly lows while oil closed near its weekly high; both moves are stretched, so the first test of those extremes sets the tone.

Tomorrow's market movers · Monday, October 19

No major U.S. releases or tracked driver earnings scheduled.

U.S. releases, high and medium impact.

NQ / MNQE-mini / Micro E-mini Nasdaq-100Weekly thesis · INTACT

The Lines in the Sand

29,268.75Friday's weekly low and the last floor bears must crack
29,462.5Reclaim it and late shorts start feeling the squeeze
30,000Bears' last stand; above it the downside story breaks

The Trap

After a drop this big, late shorts tend to pile in right at the lows, just as a snapback rally starts. Early bottom-pickers get hurt the same way when the hourly chart is still making lower highs.

Last price29,389.75
ADR · 30 sessions473.66 pts
Daily EMA2130,512.61REJECT
Reopen gapNo opening gap
29,25029,50029,75030,00030,25030,50030,75031,00031,250close 16:00Mon 9:30close 16:00Tue 9:30close 16:00Wed 9:30close 16:00Thu 9:30close 16:00Fri 9:30close 16:00Prior week low · 30,792H1 · EMA21 · NQ / MNQ 29,389.75Yellow: 09:30 open · dashed gray: 16:00 close (ET)

The Read

Bears ran the board Friday. Price knifed through the prior-week 30792 low, got slapped down at the 30512.61 EMA21 on heavy volume, and closed at 29389.75, just above the 29268.75 weekly low. The hourly chart keeps stacking lower highs under a falling average, and the weight of evidence sits with the bears. The strongest counter: the move is badly stretched from its average, and crowd pessimism has run above normal for 36 straight weeks, which is squeeze fuel. Lose 29268.75 and the floor is gone. Recover 29462.50 and the late shorts are offside, while 30000 is where the bearish story falls apart.

Yesterday's daily candle · Fri, Oct 16
Open30,086High30,224.5Low29,268.75Close29,389.75
bearish · range 955.75 pts
Projected range · next session680 pts28,940 – 29,620

Index drivers

Nearly every heavyweight closed lower Friday. Broadcom and Meta took the hardest hits, and Nvidia, Microsoft, Amazon, Alphabet and Tesla were all in the red too. Apple was the only gainer, and Meta and Tesla both report Oct. 21 after the close.

Market data as of Oct 18, 6:33 PM EDT · Weights as of 2026-09-30

Evidence · 12 cited findings

Price action · weekly / daily / H1

  • Weekly price swept and accepted below the prior-week 30792 low, then closed at 29389.75 near the 29268.75 weekly low after a 2021.25-point bearish range.
  • The daily candle rejected the 30512.61 EMA21, closed 1122.86 points below it and carried 1.62x 30-day average volume; its 2.02-ADR range confirms forceful selling but raises snapback risk.
  • H1 structure remains below a rapidly falling EMA21 after sequential lower highs and lows; a close below 29268.75 confirms continuation, while recovery above 29462.50 would support an oversold rebound.

Metrics

  • Friday's 29389.75 close was below the daily EMA21 and followed a bearish daily body ratio of 0.7285.
  • The daily range was 2.018 ADR and the close sat 2.371 ADR below the EMA21, supporting downside control while warning that the move is extended.
  • Heavyweight technology drivers were broadly weak Friday: NVDA -1.43%, MSFT -1.93%, AMZN -1.87%, META -3.72%, AVGO -4.52%, GOOGL -2.47% and TSLA -2.13%; AAPL was the exception at +0.43%. QQQ weight source: https://www.invesco.com/qqq-etf/en/about.html
  • Treasury's Oct. 16 curve showed the 2-year yield at 4.74% and 10-year at 5.09%, below October highs of 4.84% and 5.31%; high yields remain a headwind, but their retreat reduces the intensity. https://home.treasury.gov/resource-center/data-chart-center/interest-rates/TextView?field_tdr_date_value_month=202610&type=daily_treasury_yield_curve

Sentiment & current events

  • AAII measured 38.7% bullish, 19.7% neutral and 41.6% bearish sentiment, a -2.9-point spread and the 36th consecutive week of above-average bearishness; this creates contrarian squeeze risk against the bearish read. https://www.aaii.com/latest/article/553747-aaii-sentiment-survey-pessimism-rises
  • Cboe confirms a 19.99 VIX close and a 3.53-point rise on Oct. 16, but its percentage fields are internally inconsistent, so only the close and point move are usable. https://cdn-api.cboe.com/api/global/delayed_quotes/quotes/_VIX.json
  • No FOMC decision, minutes or listed Board-governor speech is scheduled for Oct. 19-23; the next decision is Oct. 28. https://www.federalreserve.gov/newsevents/2026-october.htm
  • October flash US PMI is scheduled for Friday Oct. 23 at 9:45 a.m. ET, outside this overnight forecast window. https://www.pmi.spglobal.com/Public/Home/PDF/UK_Rel_Dates
  • Meta and Tesla earnings are listed for Oct. 21 after the close in supplied driver evidence, adding later-week technology-event risk; their estimates and timing were not independently rechecked.
Sources & evidence dates · 31
  1. The Federal Reserve calendar confirms no FOMC decision or minutes during Oct. 19-23, 2026. The next FOMC meeting is Oct. 27-28, with the decision at 2:00 p.m. ET and press conference at 2:30 p.m. ET on Oct. 28. No Board-governor speech is listed for Oct. 19-23.2026-10-06
  2. pmi.spglobal.com2026-10-15
  3. tradingeconomics.com2026-10-16
  4. Treasury's official Oct. 16 curve reports the 2-year yield at 4.74% and the 10-year at 5.09%. The October highs through Oct. 16 were 4.84% and 5.31%, respectively.2026-10-16
  5. Fed-funds futures implied an 83.9% hold probability and 16.1% probability of a 25-bp hike at the Oct. 28 meeting, with effectively zero cut probability.2026-10-18
  6. AAII reports 38.7% bullish, 19.7% neutral and 41.6% bearish sentiment, producing a -2.9-point bull-bear spread. Bearish sentiment was above its historical average for the 36th consecutive week.2026-10-15
  7. cdn-api.cboe.com2026-10-16T16:15:01-04:00
  8. reuters.com2026-10-18T10:29:00Z
  9. reuters.com2026-10-18T10:29:00Z
  10. The submitted MNQ, MES, MGC and MCL price-action levels, EMA values, volume ratios, ADR multiples, predicted candles and expected paths have no cited market-data source and cannot be independently treated as current.
  11. Yahoo2026-10-18T21:33:00.000Z
  12. Yahoo2026-10-18T21:05:00.000Z
  13. Yahoo2026-10-18T20:50:00.000Z
  14. Yahoo2026-10-18T13:28:00.000Z
  15. Yahoo2026-10-18T13:10:11.000Z
  16. Yahoo2026-10-18T20:20:00.000Z
  17. Yahoo2026-10-18T18:00:02.000Z
  18. Yahoo2026-10-18T16:09:33.000Z
  19. SeekingAlpha2026-10-18T15:31:55.000Z
  20. Yahoo2026-10-18T14:38:21.000Z
  21. Yahoo2026-10-18T10:39:01.000Z
  22. Yahoo2026-10-18T20:11:47.000Z
  23. Yahoo2026-10-18T18:59:00.000Z
  24. Yahoo2026-10-18T18:00:00.000Z
  25. Yahoo2026-10-18T18:30:29.000Z
  26. Yahoo2026-10-18T14:34:48.000Z
  27. Yahoo2026-10-18T18:00:16.000Z
  28. Yahoo2026-10-18T16:35:00.000Z
  29. Yahoo2026-10-18T15:33:00.000Z
  30. Yahoo2026-10-18T20:23:00.000Z
  31. Yahoo2026-10-18T19:35:00.000Z
ES / MESE-mini / Micro E-mini S&P 500Weekly thesis · INTACT

The Lines in the Sand

7,676Weekly low; the shelf bears have to break next
7,733.25Get back above it and a relief bounce opens up
7,790Bears' ceiling; above it the downside story breaks

The Trap

With the close just 27 points above the low, the crowd tends to lean hard on the breakdown and get squeezed when a stretched market snaps back. The opposite mistake is reading every small bounce as the bottom while price stays under the falling hourly average.

Last price7,703
ADR · 30 sessions77.41 pts
Daily EMA217,788.69REJECT
Reopen gapNo opening gap
7,6757,7007,7257,7507,7757,8007,8257,8507,8757,900close 16:00Mon 9:30close 16:00Tue 9:30close 16:00Wed 9:30close 16:00Thu 9:30close 16:00Fri 9:30close 16:00Prior week high · 7,897.5Prior week low · 7,760H1 · EMA21 · ES / MES 7,703Yellow: 09:30 open · dashed gray: 16:00 close (ET)

The Read

Bulls lost the prior-week 7760 low and never got it back. The daily candle bounced off the 7788.69 EMA21 and failed on heavy volume, the hourly chart dropped from 7808.25 to 7676, and the week closed at 7703, just 27 points off the bottom. Bears hold the edge, and the evidence clearly backs them. The strongest counter is the stretch: the session ran far past its normal daily range, and stubborn crowd pessimism leaves room for a sharp bounce. Lose 7676 and the floor is gone. Reclaim 7733.25 and a bounce is in play, but only a move through 7790 flips the story.

Yesterday's daily candle · Fri, Oct 16
Open7,789High7,809.5Low7,676Close7,703
bearish · range 133.5 pts
Projected range · next session124 pts7,618 – 7,742

Index drivers

Chip names led Friday's slide, with AMD, Micron and Broadcom hit hardest. Meta, Alphabet, Microsoft, Amazon and Nvidia also closed lower, while Apple and Berkshire Hathaway were the only names up. Meta and Tesla report Oct. 21 after the close.

Market data as of Oct 18, 6:33 PM EDT · Weights as of 2026-10-01

Evidence · 12 cited findings

Price action · weekly / daily / H1

  • Weekly price accepted below the prior-week 7760 low and closed at 7703, only 27 points above the 7676 weekly low, confirming seller control.
  • The daily candle rejected the 7788.69 EMA21 on 1.70x average volume and covered 1.73 ADR; the weak close supports continuation but also leaves extension risk.
  • H1 broke sharply from 7808.25 to 7676 and finished 52.34 points below its EMA21; sustained trade below 7676 favors continuation, while reclaiming 7733.25 supports a corrective bounce.

Metrics

  • Friday's 7703 close was below the daily EMA21 after a bearish daily body ratio of 0.6442.
  • The session used 1.725 ADR and finished 1.107 ADR below the EMA21, supporting sellers while increasing mean-reversion risk.
  • Major SPY drivers were broadly weak Friday: NVDA -1.43%, MSFT -1.93%, AMZN -1.87%, META -3.72%, AVGO -4.52%, GOOGL -2.47%, MU -5.63% and AMD -5.95%; AAPL and Berkshire were positive exceptions. SPY weight source: https://www.ssga.com/us/en/intermediary/etfs/state-street-spdr-sp-500-etf-trust-spy
  • Treasury's Oct. 16 curve showed 4.74% at two years and 5.09% at ten years; both were below their October highs, which moderates but does not remove the valuation headwind. https://home.treasury.gov/resource-center/data-chart-center/interest-rates/TextView?field_tdr_date_value_month=202610&type=daily_treasury_yield_curve

Sentiment & current events

  • AAII's -2.9-point bull-bear spread and 36 consecutive weeks of above-average bearishness create contrarian rebound risk. https://www.aaii.com/latest/article/553747-aaii-sentiment-survey-pessimism-rises
  • Cboe confirms VIX at 19.99, up 3.53 points, but conflicting percentage fields prevent using an exact daily percentage. https://cdn-api.cboe.com/api/global/delayed_quotes/quotes/_VIX.json
  • No FOMC decision, minutes or listed Board-governor speech is scheduled for Oct. 19-23. https://www.federalreserve.gov/newsevents/2026-october.htm
  • October flash US PMI is scheduled for Oct. 23 at 9:45 a.m. ET. https://www.pmi.spglobal.com/Public/Home/PDF/UK_Rel_Dates
  • Meta and Tesla earnings are listed in supplied driver evidence for Oct. 21 after the close, creating later-week index risk; estimates and timing were not independently rechecked.
Sources & evidence dates · 39
  1. The Federal Reserve calendar confirms no FOMC decision or minutes during Oct. 19-23, 2026. The next FOMC meeting is Oct. 27-28, with the decision at 2:00 p.m. ET and press conference at 2:30 p.m. ET on Oct. 28. No Board-governor speech is listed for Oct. 19-23.2026-10-06
  2. pmi.spglobal.com2026-10-15
  3. tradingeconomics.com2026-10-16
  4. Treasury's official Oct. 16 curve reports the 2-year yield at 4.74% and the 10-year at 5.09%. The October highs through Oct. 16 were 4.84% and 5.31%, respectively.2026-10-16
  5. Fed-funds futures implied an 83.9% hold probability and 16.1% probability of a 25-bp hike at the Oct. 28 meeting, with effectively zero cut probability.2026-10-18
  6. AAII reports 38.7% bullish, 19.7% neutral and 41.6% bearish sentiment, producing a -2.9-point bull-bear spread. Bearish sentiment was above its historical average for the 36th consecutive week.2026-10-15
  7. cdn-api.cboe.com2026-10-16T16:15:01-04:00
  8. reuters.com2026-10-18T10:29:00Z
  9. reuters.com2026-10-18T10:29:00Z
  10. The submitted MNQ, MES, MGC and MCL price-action levels, EMA values, volume ratios, ADR multiples, predicted candles and expected paths have no cited market-data source and cannot be independently treated as current.
  11. Yahoo2026-10-18T21:33:00.000Z
  12. Yahoo2026-10-18T21:05:00.000Z
  13. Yahoo2026-10-18T20:50:00.000Z
  14. Yahoo2026-10-18T13:28:00.000Z
  15. Yahoo2026-10-18T13:10:11.000Z
  16. Yahoo2026-10-18T20:20:00.000Z
  17. Yahoo2026-10-18T18:00:02.000Z
  18. Yahoo2026-10-18T16:09:33.000Z
  19. SeekingAlpha2026-10-18T15:31:55.000Z
  20. Yahoo2026-10-18T14:38:21.000Z
  21. Yahoo2026-10-18T10:39:01.000Z
  22. Yahoo2026-10-18T20:11:47.000Z
  23. Yahoo2026-10-18T18:59:00.000Z
  24. Yahoo2026-10-18T18:00:00.000Z
  25. Yahoo2026-10-18T18:30:29.000Z
  26. Yahoo2026-10-18T14:34:48.000Z
  27. Yahoo2026-10-18T18:00:16.000Z
  28. Yahoo2026-10-18T16:35:00.000Z
  29. Yahoo2026-10-18T15:33:00.000Z
  30. Yahoo2026-10-18T20:23:00.000Z
  31. Yahoo2026-10-18T19:35:00.000Z
  32. Yahoo2026-10-18T20:05:00.000Z
  33. Yahoo2026-10-18T16:52:52.000Z
  34. Yahoo2026-10-18T16:04:00.000Z
  35. Yahoo2026-10-18T21:10:58.000Z
  36. Yahoo2026-10-18T09:30:00.000Z
  37. Yahoo2026-10-18T11:50:00.000Z
  38. SeekingAlpha2026-10-18T09:15:00.000Z
  39. Yahoo2026-10-17T22:50:00.000Z
GC / MGCGold / Micro GoldWeekly thesis · INTACT

The Lines in the Sand

4,220.5Top of the box where the breakout attempt died
4,167.5Bottom of the box; lose it and balance ends
4,091.2Prior-week low; deeper support that held all week

The Trap

In a tight box on light volume, the crowd tends to chase each poke at the edges, then gets caught when price snaps back inside. Last week's failed run past the prior-week high caught breakout chasers exactly that way.

Last price4,186.5
ADR · 30 sessions87.11 pts
Daily EMA214,230.29REJECT
Reopen gapNo opening gap
4,1004,1204,1404,1604,1804,2004,2204,240close 13:30Mon 8:20close 13:30Tue 8:20close 13:30Wed 8:20close 13:30Thu 8:20close 13:30Fri 8:20close 13:30Prior week high · 4,233.5Prior week low · 4,091.2H1 · EMA21 · GC / MGC 4,186.5Yellow: 08:20 open · dashed gray: 13:30 close (ET)

The Read

Bulls pushed past last week's high, couldn't hold it, and the week closed lower at 4186.5. Friday printed an indecisive doji under the 4230.29 EMA21 on light volume, so neither side was in control. The hourly chart bounced hard off 4094.80, then stalled near 4220.50, boxing price between 4167.50 and 4220.50. The failed breakout tilts things slightly lower, but only slightly; easing yields and unsettled Hormuz headlines could still give gold support. Get accepted above 4220.50 and the failed breakout is repaired. Lose 4167.50 and the path toward 4091.20 opens.

Yesterday's daily candle · Fri, Oct 16
Open4,192High4,220.5Low4,167.5Close4,186.5
doji · range 53 pts
Projected range · next session66 pts4,158 – 4,224
⚠ Flat / choppy conditions likely
Evidence · 7 cited findings

Price action · weekly / daily / H1

  • Weekly price briefly exceeded the prior-week high but failed acceptance and closed bearish at 4186.5, producing a failed-breakout signal without breaking 4091.20 support.
  • The daily candle formed a low-body doji below the 4230.29 EMA21 after using only 0.61 ADR, showing compression and balance rather than directional control.
  • H1 recovered sharply from 4094.80 but stalled near 4220.50 and finished slightly below its 4189.22 EMA21; 4167.50-4220.50 defines the immediate balance area.

Metrics

  • The daily body ratio was only 0.1038 and the close was 0.503 ADR below the daily EMA21, consistent with indecision rather than decisive continuation.
  • Volume was 0.774x the 30-day average, withholding confirmation from the failed weekly breakout.
  • Treasury yields remain elevated at 4.74% for two years and 5.09% for ten years, a gold headwind, but both eased from October highs. https://home.treasury.gov/resource-center/data-chart-center/interest-rates/TextView?field_tdr_date_value_month=202610&type=daily_treasury_yield_curve

Sentiment & current events

  • No FOMC decision, minutes or listed Board-governor speech is scheduled for Oct. 19-23. https://www.federalreserve.gov/newsevents/2026-october.htm
Sources & evidence dates · 3
  1. reuters.com2026-10-18T10:29:00Z
  2. reuters.com2026-10-18T10:29:00Z
  3. The submitted MNQ, MES, MGC and MCL price-action levels, EMA values, volume ratios, ADR multiples, predicted candles and expected paths have no cited market-data source and cannot be independently treated as current.
CL / MCLWTI Crude Oil / Micro WTI Crude OilWeekly thesis · INTACT

The Lines in the Sand

99.35Weekly high; holding above it keeps the momentum going
98.18Bulls' floor; heavy trade below it signals exhaustion
92.13Prior-week high where the breakout started

The Trap

After a run this stretched, latecomers tend to chase at the top just as the move tires, and early faders get run over when another headline adds fuel. Both get burned the same way: they ignore how much this market swings on Hormuz news.

Last price99.07
ADR · 30 sessions3.62 pts
Daily EMA2191.28HOLD
Reopen gapNo opening gap
9092949698100close 14:30Mon 9:00close 14:30Tue 9:00close 14:30Wed 9:00close 14:30Thu 9:00close 14:30Fri 9:00close 14:30Prior week high · 92.13H1 · EMA21 · CL / MCL 99.07Yellow: 09:00 open · dashed gray: 14:30 close (ET)

The Read

Shorts got run over. Price blew through the prior-week 92.13 high, held above it, and closed at 99.07, just under the 99.35 weekly high, on roughly nine times normal volume. The evidence clearly favors bulls, and the hourly chart is coiling just under the high instead of giving ground. The strongest counter is the stretch: price sits far above its 91.28 average, the Hormuz reopening timetable is disputed, and the contract roll timing is unclear. The EIA weekly petroleum report lands Oct. 21 at 10:30 a.m. ET. Hold above 99.35 and the door stays open. Fall back below 98.18 and stay there, and the run looks spent.

Yesterday's daily candle · Fri, Oct 16
Open96.11High99.35Low95.3Close99.07
bullish · range 4.05 pts
Projected range · next session4.3 pts97.85 – 102.15
Evidence · 6 cited findings

Price action · weekly / daily / H1

  • Weekly structure is strongly bullish: price cleared and accepted above the prior-week 92.13 high, then closed at 99.07 near the 99.35 weekly extreme.
  • The daily candle closed 7.79 points above the 91.28 EMA21 with a 0.7309 bullish body and exceptional 9.15x average volume, confirming aggressive demand while creating extension risk.
  • H1 produced consecutive upside expansions through 96.87 and 98.78 before consolidating beneath 99.35; acceptance above 99.35 favors continuation, while failure below 98.18 signals exhaustion.

Metrics

  • Friday's daily range was 1.12 ADR and the close was 2.155 ADR above the EMA21, supporting momentum but showing substantial extension.
  • The 9.148x volume ratio is the strongest quantitative confirmation among the four supplied markets.

Sentiment & current events

  • The EIA Weekly Petroleum Status Report is scheduled for Wednesday Oct. 21 at 10:30 a.m. ET. https://www.eia.gov/petroleum/supply/weekly/
Sources & evidence dates · 6
  1. The EIA Weekly Petroleum Status Report is scheduled for Wednesday Oct. 21 at 10:30 a.m. ET.
  2. eia.gov2026-10-15
  3. OPEC+ reportedly kept November production targets unchanged on Oct. 4 and scheduled its next review for Nov. 1, but direct retrieval of the cited OPEC release was blocked and the primary text was not independently reviewed.2026-10-04
  4. reuters.com2026-10-18T10:29:00Z
  5. reuters.com2026-10-18T10:29:00Z
  6. The submitted MNQ, MES, MGC and MCL price-action levels, EMA values, volume ratios, ADR multiples, predicted candles and expected paths have no cited market-data source and cannot be independently treated as current.

Free. Always. Futures trading edge in your inbox.

You're in. Watch your inbox.

We do not send junk mail. We do not spam.