Session Prep

Two minutes tonight. A plan tomorrow.
Evening edition · Data as of Thu, Oct 15, 5:00 PM EDT · All times Eastern
Deep research

Tonight's one thing

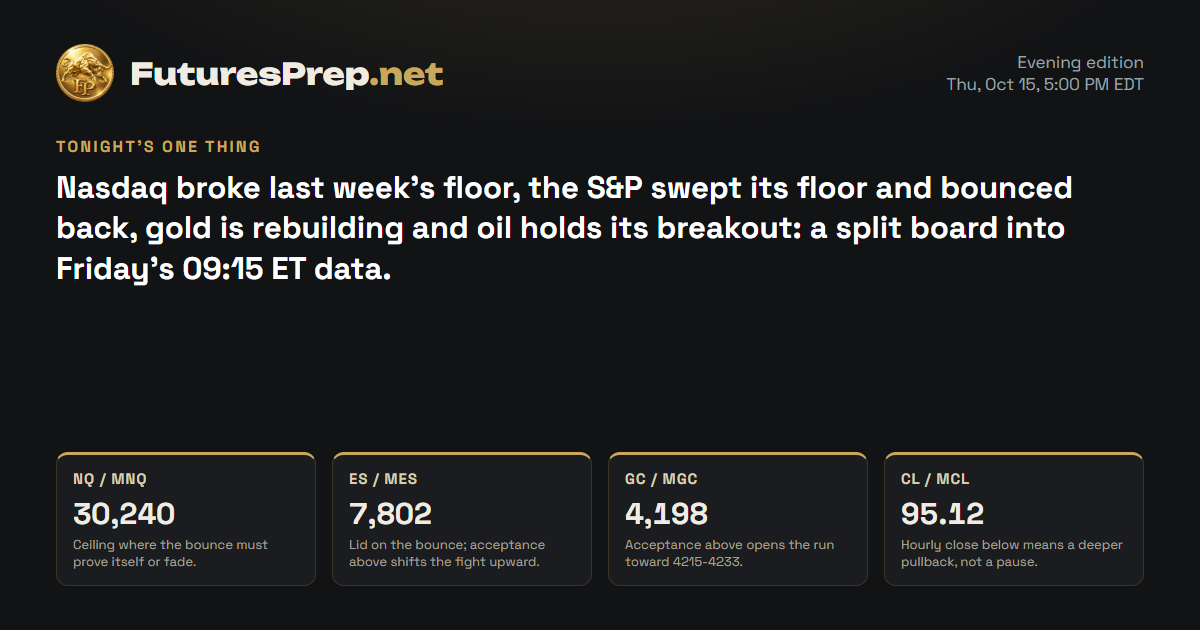
Nasdaq broke last week's floor, the S&P swept its floor and bounced back, gold is rebuilding and oil holds its breakout: a split board into Friday's 09:15 ET data.

Tomorrow's market movers · Friday, October 16

No major U.S. releases or tracked driver earnings scheduled.

U.S. releases, high and medium impact.

NQ / MNQE-mini / Micro E-mini Nasdaq-100Weekly thesis · INVALIDATED

The Lines in the Sand

30,240Ceiling where the bounce must prove itself or fade.
30,035Hourly close below hands control back to the bears.
29,622.25This week's flush low, where bulls finally showed up.

The Trap

After a drop this big, the crowd chases the move late and gets squeezed by snap-back rallies like the one off 29622.25. The other side gets caught too: bottom-pickers treat one strong recovery hour as a reversal while price is still capped under 30240.

Last price30,077.75
ADR · 30 sessions458.75 pts
Daily EMA2130,621.55REJECT
Reopen gapNo opening gap
29,60029,80030,00030,20030,40030,60030,80031,00031,20031,400close 16:00Fri 9:30close 16:00Mon 9:30close 16:00Tue 9:30close 16:00Wed 9:30close 16:00Thu 9:30close 16:00Prior week low · 30,792H1 · EMA21 · NQ / MNQ 30,077.75Yellow: 09:30 open · dashed gray: 16:00 close (ET)

The Read

Bears won the week, and bulls are trying to steal the last round. MNQ broke through the 30792 prior-week low, flushed to 29622.25, then clawed back to 30077.75 into the close. Overhead, the daily bar was turned away at the 30621.55 average, and 30197-30240 sits as a lid on the bounce. The counter-punch is real: a sharp recovery off the low plus gains in Microsoft, Alphabet and Amazon keep a mean-reversion squeeze alive. Stay capped under 30240 and an hourly close below 30035 puts 29850 and 29700 back in play; hold above 30240 and the late bears are offside.

Yesterday's daily candle · Thu, Oct 15
Open30,151High30,197Low29,622.25Close30,077.75
doji · range 574.75 pts
Projected range · next session550 pts29,685 – 30,235

Index drivers

Nvidia, Tesla and Broadcom led the heavyweights lower, with Apple and Meta slipping too. Microsoft rose, with smaller gains in Alphabet and Amazon, so the tech pressure was not one-way. Meta and Tesla report after the close on October 21, Alphabet on October 27, Microsoft on October 28 and Amazon on October 29.

Market data as of Oct 15, 6:33 PM EDT · Weights as of 2026-09-30

Evidence · 10 cited findings

Price action · weekly / daily / H1

  • Weekly structure is decisively bearish: MNQ accepted below the 30792 prior-week low and closed 1066.75 points beneath the 31144.50 weekly open with one session remaining.
  • The daily candle rejected the 30621.55 EMA21 after using 1.253 ADR, although its small doji body and recovery from 29622.25 warn against assuming immediate continuation.
  • H1 recovered above its EMA21 into the close, but the broader lower-high/lower-low sequence remains intact; 30197-30240 is resistance and an H1 close below 30035 favors renewed pressure toward 29850 and 29700.

Metrics

  • The weekly bullish weekly view is invalidated by acceptance beneath 30792; restoring the weekly objective would require 1066.75 points against a remaining 458.75-point ADR budget, a 2.325 feasibility ratio classified as implausible.
  • The completed daily range was 574.75 points, or 1.253 ADR, so fresh downside may be less efficient without consolidation or a failed rebound.
  • The final H1 range was 118.75 points versus a 105-point expansion threshold and was already expanding, increasing volatility risk without independently changing the bearish direction.
  • Exact December 2026 exchange-grade futures bars and settlement were not independently retrieved, so supplied technical levels remain feed-dependent: https://www.cmegroup.com/market-data.html

Sentiment & current events

  • September CPI was 0.6% m/m and 3.7% y/y, while September final-demand PPI was 1.3% m/m and 6.3% y/y; these are prior releases rather than fresh overnight catalysts: https://www.bls.gov/news.release/cpi.nr0.htm and https://www.bls.gov/news.release/ppi.nr0.htm
  • Large-cap technology drivers were mixed: NVDA fell 1.8391%, TSLA fell 1.2855% and AVGO fell 0.5545%, while MSFT rose 1.0774%, limiting the breadth of bearish confirmation: https://www.invesco.com/qqq-etf/en/about.html
  • The strongest contradiction is the sharp recovery from 29622.25 combined with gains in MSFT, GOOGL and AMZN, which leaves material mean-reversion risk.
Sources & evidence dates · 26
  1. federalreserve.gov
  2. BLS reported September 2026 CPI at +0.6% m/m and +3.7% y/y, with core CPI at +0.3% m/m and +2.6% y/y. Gasoline rose 9.1% and accounted for more than half of the monthly headline increase. Consensus comparisons and immediate cross-asset reactions are not established by this primary source.2026-10-14
  3. bls.gov2026-10-15
  4. census.gov2026-10-15
  5. federalreserve.gov
  6. The alleged Hormuz mine or vessel strikes were not corroborated during this check by current UKMTO incident notices, flag-state reporting or another independent maritime primary source. IRNA and belligerent statements alone do not establish the incidents as fact.2026-10-11T21:46:00+03:30
  7. cmegroup.com
  8. investing.com
  9. Yahoo2026-10-15T21:50:00.000Z
  10. Yahoo2026-10-15T21:43:00.000Z
  11. Yahoo2026-10-15T21:25:00.000Z
  12. Yahoo2026-10-15T21:01:03.000Z
  13. Yahoo2026-10-15T20:44:34.000Z
  14. Yahoo2026-10-15T19:41:00.000Z
  15. Yahoo2026-10-15T21:00:00.000Z
  16. Yahoo2026-10-15T20:13:00.000Z
  17. Yahoo2026-10-15T20:41:56.000Z
  18. Yahoo2026-10-15T20:30:57.000Z
  19. Yahoo2026-10-15T20:27:07.000Z
  20. Yahoo2026-10-15T19:42:00.000Z
  21. Yahoo2026-10-15T19:22:58.000Z
  22. Yahoo2026-10-15T18:11:01.000Z
  23. Yahoo2026-10-15T21:42:16.000Z
  24. Yahoo2026-10-15T21:48:00.000Z
  25. Yahoo2026-10-15T21:37:13.000Z
  26. Yahoo2026-10-15T20:08:40.000Z
ES / MESE-mini / Micro E-mini S&P 500Weekly thesis · INVALIDATED

The Lines in the Sand

7,802Lid on the bounce; acceptance above shifts the fight upward.
7,769Hourly close below reopens the slide toward 7745 and 7717.
7,760Last week's low, swept but never truly broken.

The Trap

The sweep below 7760 caught breakdown chasers who piled in late, then watched price snap right back above it. Now the risk flips: a crowd leaning on a fresh rally runs into the 7797-7802 resistance that turned the daily bar away.

Last price7,786.25
ADR · 30 sessions76.48 pts
Daily EMA217,796.74REJECT
Reopen gapNo opening gap
7,7207,7407,7607,7807,8007,8207,8407,8607,8807,900close 16:00Fri 9:30close 16:00Mon 9:30close 16:00Tue 9:30close 16:00Wed 9:30close 16:00Thu 9:30close 16:00Prior week high · 7,897.5Prior week low · 7,760H1 · EMA21 · ES / MES 7,786.25Yellow: 09:30 open · dashed gray: 16:00 close (ET)

The Read

Bears swept the floor and could not keep it. MES took out the 7760 prior-week low and dropped to 7717.25, then bulls dragged it back to 7786.25, just under the 7796.74 average. The week is still red below its 7872.50 open, but a breakdown nobody can hold is a weak breakdown. The hourly bars shrank into the close, so neither side has the fuel yet. Hold 7770 and another test of 7802 is on the table, with acceptance above 7802 opening the door; an hourly close below 7769 puts 7745 and 7717 back in play.

Yesterday's daily candle · Thu, Oct 15
Open7,768.25High7,801.75Low7,717.25Close7,786.25
bullish · range 84.5 pts
Projected range · next session64 pts7,748 – 7,812
⚠ Flat / choppy conditions likely

Index drivers

Nvidia, AMD, Tesla and Broadcom fell, while Microsoft, Micron, Alphabet and Amazon rose, leaving a split board with neither a clean risk-on day nor a capitulation. Meta and Tesla report after the close on October 21, Alphabet on October 27, Microsoft on October 28 and Amazon on October 29.

Market data as of Oct 15, 6:33 PM EDT · Weights as of 2026-10-01

Evidence · 10 cited findings

Price action · weekly / daily / H1

  • Weekly price remains below its 7872.50 open after taking the 7760 prior-week low, but failure to accept beneath 7760 weakens the breakdown and supports a flat read.
  • The bullish daily candle recovered most of the 7717.25-7801.75 range and closed only 10.49 points below the 7796.74 EMA21, although the recorded EMA rejection leaves 7797-7802 as resistance.
  • H1 closed above its short-term EMA following the 09:00 low reversal, but the final bar contracted; holding 7770 favors another 7802 test while an H1 close below 7769 reopens 7745 and 7717.

Metrics

  • The weekly bullish weekly view is marked invalidated after overshooting beneath its declared structure, although price neither closed nor accepted below the 7760 invalidation level.
  • Reaching the original objective requires 86.25 points against a remaining 76.48-point ADR budget, a 1.128 feasibility ratio classified as implausible.
  • The last H1 range was 12 points versus an 18.5-point expansion threshold, confirming contraction into the close.
  • Exact December 2026 exchange-grade bars and settlement were not independently retrieved: https://www.cmegroup.com/market-data.html

Sentiment & current events

  • September CPI and PPI showed elevated headline inflation, but they are prior releases and their immediate cross-asset reactions were not established by the primary sources: https://www.bls.gov/news.release/cpi.nr0.htm and https://www.bls.gov/news.release/ppi.nr0.htm
  • S&P 500 drivers were mixed: NVDA and AMD declined while MSFT, GOOGL, AMZN and MU advanced, supporting neither clean risk-on nor broad capitulation: https://www.ssga.com/us/en/intermediary/etfs/state-street-spdr-sp-500-etf-trust-spy
  • The strongest contradiction to a red weekly close is the rejection of the 7717.25 low and recovery to 7786.25 without acceptance beneath 7760.
Sources & evidence dates · 33
  1. federalreserve.gov
  2. BLS reported September 2026 CPI at +0.6% m/m and +3.7% y/y, with core CPI at +0.3% m/m and +2.6% y/y. Gasoline rose 9.1% and accounted for more than half of the monthly headline increase. Consensus comparisons and immediate cross-asset reactions are not established by this primary source.2026-10-14
  3. bls.gov2026-10-15
  4. census.gov2026-10-15
  5. federalreserve.gov
  6. reuters.com2026-10-03
  7. The alleged Hormuz mine or vessel strikes were not corroborated during this check by current UKMTO incident notices, flag-state reporting or another independent maritime primary source. IRNA and belligerent statements alone do not establish the incidents as fact.2026-10-11T21:46:00+03:30
  8. cmegroup.com
  9. investing.com
  10. Yahoo2026-10-15T21:50:00.000Z
  11. Yahoo2026-10-15T21:43:00.000Z
  12. Yahoo2026-10-15T21:25:00.000Z
  13. Yahoo2026-10-15T21:01:03.000Z
  14. Yahoo2026-10-15T20:44:34.000Z
  15. Yahoo2026-10-15T19:41:00.000Z
  16. Yahoo2026-10-15T21:00:00.000Z
  17. Yahoo2026-10-15T20:13:00.000Z
  18. Yahoo2026-10-15T20:41:56.000Z
  19. Yahoo2026-10-15T20:30:57.000Z
  20. Yahoo2026-10-15T20:27:07.000Z
  21. Yahoo2026-10-15T19:42:00.000Z
  22. Yahoo2026-10-15T19:22:58.000Z
  23. Yahoo2026-10-15T18:11:01.000Z
  24. Yahoo2026-10-15T21:42:16.000Z
  25. Yahoo2026-10-15T21:48:00.000Z
  26. Yahoo2026-10-15T21:37:13.000Z
  27. Yahoo2026-10-15T20:08:40.000Z
  28. Yahoo2026-10-15T21:00:20.000Z
  29. Yahoo2026-10-15T20:30:16.000Z
  30. Yahoo2026-10-15T20:30:00.000Z
  31. Yahoo2026-10-15T11:10:00.000Z
  32. CNBC2026-10-15T10:35:46.000Z
  33. Yahoo2026-10-15T10:14:00.000Z
GC / MGCGold / Micro GoldWeekly thesis · STRESSED

The Lines in the Sand

4,198Acceptance above opens the run toward 4215-4233.
4,165Lose this on an hourly close and the rebound breaks.
4,232.51Daily average overhead, the bulls' unfinished business.

The Trap

Late bulls tend to chase the bounce straight into 4220-4242 supply, the same zone that rejected the week's push above 4233.50. On the flip side, bears leaning on the red weekly candle already got caught by the sharp recovery off 4094.80.

Last price4,192.9
ADR · 30 sessions89.74 pts
Daily EMA214,232.51REJECT
Reopen gapNo opening gap
4,1004,1204,1404,1604,1804,2004,2204,240close 13:30Fri 8:20close 13:30Mon 8:20close 13:30Tue 8:20close 13:30Wed 8:20close 13:30Thu 8:20close 13:30Prior week high · 4,233.5Prior week low · 4,091.2H1 · EMA21 · GC / MGC 4,192.9Yellow: 08:20 open · dashed gray: 13:30 close (ET)

The Read

Bears owned the start of the week, and bulls owned Thursday. Gold failed its break above the 4233.50 prior-week high, sank to 4094.80, then climbed back to 4192.90, closing near the 4197.70 high. The tell is the hourly rebuild: higher lows above its average and a tight final hour. The counter-argument is plain: price still sits below the 4232.51 daily average, and the ETF and central-bank demand behind gold is real but lagged. Accept above 4198 and the door opens toward 4215-4233; lose 4165 on an hourly close and the bounce is broken.

Yesterday's daily candle · Thu, Oct 15
Open4,128High4,197.7Low4,120.9Close4,192.9
bullish · range 76.8 pts
Projected range · next session72 pts4,168 – 4,240
Evidence · 10 cited findings

Price action · weekly / daily / H1

  • The weekly candle remains red and rejected its break above the 4233.50 prior-week high, but price recovered almost 100 points from 4094.80 and is again approaching 4220-4242 supply.
  • Daily price printed a bullish 0.8451 body-ratio candle and closed near its 4197.70 high; the main contradiction is that 4192.90 remains below the 4232.51 EMA21.
  • H1 rebuilt above its EMA21 with higher lows and a late push to 4197.70; acceptance above 4198 favors 4215-4233, while loss of 4165 invalidates near-term continuation.

Metrics

  • The weekly bullish weekly view is stressed rather than fully invalidated; only 28.10 points are required to reach its arithmetic floor against an 89.74-point remaining ADR budget, a comfortable 0.313 ratio.
  • Thursday used 0.856 ADR and closed 72 points above its open, leaving room for continuation without an already exhausted daily range.
  • The last H1 range contracted to 8.5 points versus a 23.9-point expansion threshold, supporting a later volatility release if 4198 is accepted.
  • Exact exchange-grade MGC bars and settlement were not independently retrieved: https://www.cmegroup.com/market-data.html

Sentiment & current events

  • World Gold Council data showed US$10 billion of September gold-ETF inflows and record US$31 billion Q3 inflows, supportive but lagged: https://www.gold.org/goldhub/research/gold-etfs-holdings-and-flows/2026/10
  • World Gold Council reported 39 tonnes of net central-bank buying in August and about 170 tonnes year to date through August, also supportive but lagged: https://www.gold.org/goldhub/gold-focus/2026/10/central-bank-gold-statistics-central-banks-continue-summer-spree-august
  • The strongest contradiction is the daily close below the 4232.51 EMA21 after the weekly rejection above the prior-week high.
Sources & evidence dates · 11
  1. federalreserve.gov
  2. BLS reported September 2026 CPI at +0.6% m/m and +3.7% y/y, with core CPI at +0.3% m/m and +2.6% y/y. Gasoline rose 9.1% and accounted for more than half of the monthly headline increase. Consensus comparisons and immediate cross-asset reactions are not established by this primary source.2026-10-14
  3. bls.gov2026-10-15
  4. census.gov2026-10-15
  5. gold.org2026-10-07
  6. gold.org2026-10-06
  7. federalreserve.gov
  8. reuters.com2026-10-03
  9. The alleged Hormuz mine or vessel strikes were not corroborated during this check by current UKMTO incident notices, flag-state reporting or another independent maritime primary source. IRNA and belligerent statements alone do not establish the incidents as fact.2026-10-11T21:46:00+03:30
  10. cmegroup.com
  11. investing.com
CL / MCLWTI Crude Oil / Micro WTI Crude OilWeekly thesis · FULFILLED

The Lines in the Sand

95.12Hourly close below means a deeper pullback, not a pause.
96.74Week's high, where the run stalled and compressed.
92.13Old ceiling broken and held, the breakout's foundation.

The Trap

After a run this extended, latecomers pile in near 96.74 and get shaken out on the first pullback toward 95.12. Fading the move just because it looks stretched has burned the bears too, since price has stayed above the old 92.13 ceiling.

Last price96.13
ADR · 30 sessions3.54 pts
Daily EMA2190.5HOLD
Reopen gapNo opening gap
899091929394959697close 14:30Fri 9:00close 14:30Mon 9:00close 14:30Tue 9:00close 14:30Wed 9:00close 14:30Thu 9:00close 14:30Prior week high · 92.13H1 · EMA21 · CL / MCL 96.13Yellow: 09:00 open · dashed gray: 14:30 close (ET)

The Read

Bulls broke the ceiling, and bears are offside. Crude accepted above the 92.13 prior-week high, ran to 96.74 and closed at 96.13, well above the 90.95 weekly open. The fuel is verified strikes on Russian refineries, though nobody has measured the supply hit, and the Hormuz stories remain unconfirmed. The strongest counter is stretch: Thursday ran far past a normal day's range, and hourly momentum stalled near the highs. Hold 95.30 and the door stays open toward 96.74-97.40; an hourly close below 95.12 turns this into a deeper retracement.

Yesterday's daily candle · Thu, Oct 15
Open94.02High96.74Low92.47Close96.13
bullish · range 4.27 pts
Projected range · next session3.1 pts94.95 – 98.05
Evidence · 11 cited findings

Price action · weekly / daily / H1

  • Weekly structure is strongly bullish: MCL accepted above the 92.13 prior-week high and trades 5.18 above the 90.95 weekly open without sweeping the prior-week low.
  • Daily price held well above the 90.50 EMA21 and printed a bullish 0.4941 body on 3.509 times average volume; the 1.206-ADR range and 4.27-point span warn that the move is extended.
  • H1 momentum expanded through 94.80, 95.45 and 96.32 before compressing near the highs; holding 95.30 preserves continuation toward 96.74-97.40, while an H1 close below 95.12 signals a deeper retracement.

Metrics

  • The weekly bullish weekly view is fulfilled after acceptance above the prior-week high and a move beyond the declared 93.20-94.10 overshoot zone.
  • The arithmetic floor is zero and the weekly objective is classified as comfortable, so no recovery requirement remains.
  • The final H1 range was only 0.19 versus a 0.82 expansion threshold after five bars without expansion, indicating compression but not direction.
  • Current EIA inventory data and the October 13 ICE curve could not be validated as fresh inputs, so neither contributes to direction: https://www.eia.gov/petroleum/supply/weekly/ and https://www.ice.com/products/213/WTI-Crude-Futures/data?marketId=5637959

Sentiment & current events

  • Reuters verifies renewed Ukrainian strikes on Russian refineries but not the magnitude of crude or product-flow disruption: https://www.reuters.com/3fec1b0a85a0/business/aerospace-defense/ukraine-will-hit-russian-refineries-response-moscows-new-doctrine-airstrikes-2026-10-03/
  • Alleged Hormuz mine or vessel incidents were not independently corroborated and are excluded from directional evidence: https://en.irna.ir/news/86289902/Supertanker-explodes-after-hitting-mine-in-unauthorized-Hormuz
  • No U.S. Treasury or OFAC release was found supporting the claim that sanctions easing caused oil weakness: https://ofac.treasury.gov/recent-actions
  • The strongest contradiction is extension: Thursday consumed 1.206 ADR and late H1 momentum compressed after reaching 96.74.
Sources & evidence dates · 10
  1. federalreserve.gov
  2. BLS reported September 2026 CPI at +0.6% m/m and +3.7% y/y, with core CPI at +0.3% m/m and +2.6% y/y. Gasoline rose 9.1% and accounted for more than half of the monthly headline increase. Consensus comparisons and immediate cross-asset reactions are not established by this primary source.2026-10-14
  3. eia.gov2026-10-15
  4. ice.com2026-10-13
  5. federalreserve.gov
  6. reuters.com2026-10-03
  7. The alleged Hormuz mine or vessel strikes were not corroborated during this check by current UKMTO incident notices, flag-state reporting or another independent maritime primary source. IRNA and belligerent statements alone do not establish the incidents as fact.2026-10-11T21:46:00+03:30
  8. No identified U.S. Treasury or OFAC primary release was found supporting the circulating claim that sanctions easing caused oil to decline. The claim remains unusable as directional evidence.
  9. cmegroup.com
  10. investing.com

Free. Always. Futures trading edge in your inbox.

You're in. Watch your inbox.

We do not send junk mail. We do not spam.