The Lines in the Sand
The Trap
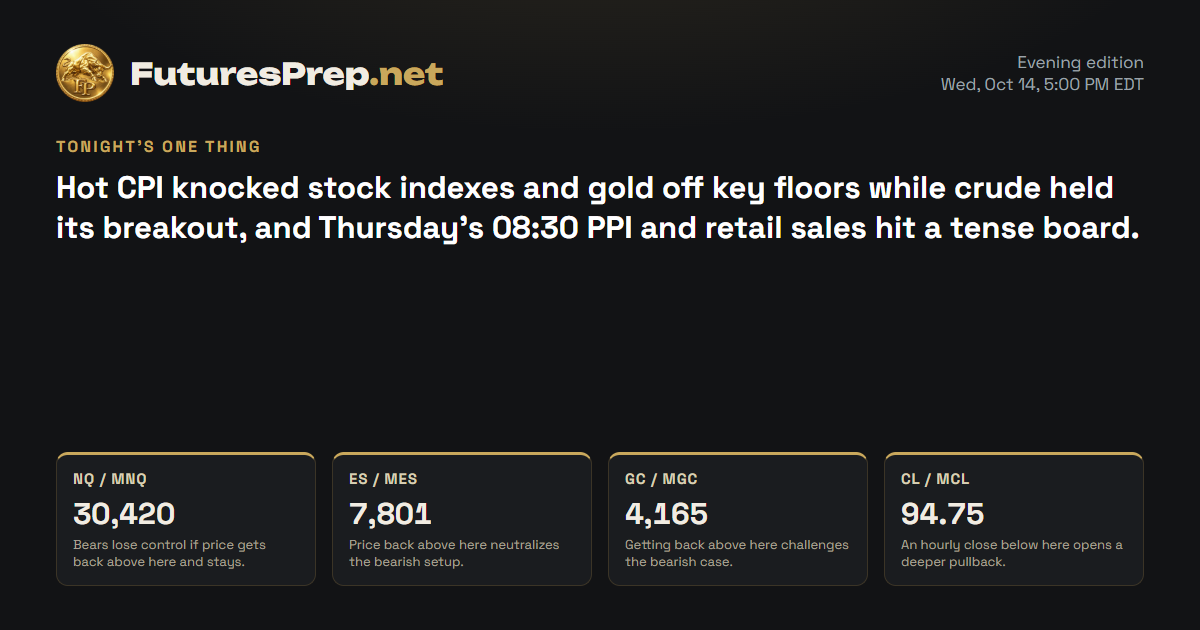
After a drop this big, the first bounce toward 30240-30320 tends to convince late bulls the bottom is in, and that's where the pressure has been coming back. The opposite trap is pressing shorts into the lows right after an unusually large range, where tired bears get squeezed by a quick reflex bounce.
The Read
Bulls tried to hold last week's low at 30792 and got run over. Price dropped from 30794.5, closed at 30138.75 and is sitting right on top of the 30078.5 weekly low. Volume came in heavy and the hourly chart keeps making lower lows, so this looks like real liquidation, not a thin slip. Hot CPI was the fuel. The best case for the bulls is exhaustion: a day this stretched often snaps back first. The evidence clearly sides with the bears. Hold below 30420 and the pressure stays on; get back above 30420 and stay there, and the downside case weakens fast.
Index drivers
| Ticker | Approx. weight | Day move | Next earnings | Top headline |
|---|---|---|---|---|
| NVDA | 8.4% | −3.16% | — | Jim Cramer Calls CoreWeave the "Real Deal," but the Stock Crashed 15% the Very Next Day. Should You Buy the Dip? |
| MSFT | 5.75% | −1.8% | Oct 28 | Microsoft Just Unveiled a Brand-New AI Chip. Could It Be the "Nvidia Killer" Everyone's Been Looking For? |
| AAPL | 7.28% | +0.5% | — | Here's What a $10,000 Investment in Apple Stock Could Be Worth in 5 Years |
| AMZN | 4.04% | −1.74% | — | Global X Investments Canada Inc. Closes the Market |
| META | 3.26% | −3.27% | Oct 21 · After close | Ambani’s Jio seeks to raise $3.2B in what could be India’s biggest IPO |
| AVGO | 2.47% | −3.1% | — | AMD Stock Takes a Bigger Hit as Cracks Emerge in the AI Trade |
| GOOGL | 3% | −1.74% | Oct 27 · After close | Ambani’s Jio seeks to raise $3.2B in what could be India’s biggest IPO |
| TSLA | 2.81% | −2.15% | Oct 20 · After close | What Is Rivian Building That Investors Should Watch? |
Nearly every heavyweight closed red: NVIDIA, Meta and Broadcom led the drop, with Tesla, Microsoft, Amazon and Alphabet also lower. Apple was the main holdout and finished higher. Tesla reports October 20 after the close, Meta October 21 after the close, Alphabet October 27 after the close, and Microsoft is scheduled for October 28.
Market data as of Oct 14, 6:33 PM EDT · Weights as of 2026-09-30
Evidence · 8 cited findings
Price action · weekly / daily / H1
- Bearish first record: weekly price accepted below the 30792 prior-week low and closed at 30138.75 near the 30078.5 weekly low after declining 1005.75 points from the weekly open.
- The daily candle was a high-volume 1.81-ADR bearish expansion, with an 80.66% body and a close 1.196 ADR below the 30675.93 EMA21.
- H1 remains below its falling EMA21 after successive lower lows; the projected sequence is a reflex bounce toward 30240-30320 followed by renewed pressure.
- The strongest price-action contradiction is exhaustion risk after an unusually large daily range; sustained acceptance above 30420 would weaken continuation odds.
Metrics
- Daily volume was 1.774 times its 30-session average, supporting initiative selling rather than a low-participation break.
- The final completed H1 range was 89 points versus a 105-point expansion threshold, so immediate hourly expansion was not active at the cutoff.
- QQQ-weighted drivers broadly confirmed risk-off pressure: NVDA fell 3.1595%, META 3.2734%, AVGO 3.0954%, MSFT 1.7959%, AMZN 1.7403%, GOOGL 1.7355%, and TSLA 2.1507%; AAPL rose 0.4952% as the principal exception (https://www.invesco.com/qqq-etf/en/about.html).
Sentiment & current events
- September CPI rose 0.6% month over month and 3.7% year over year, while core CPI rose 0.3% and 2.6%; the hot release supports pressure on rate-sensitive growth, though gasoline drove a material portion of the headline increase (https://www.bls.gov/news.release/cpi.nr0.htm?v=20261014).
Sources & evidence dates · 26
- bls.gov2026-10-14T12:30:00Z
- cmegroup.com
- census.gov2026-09-23T00:00:00Z
- dol.gov2026-10-08T00:00:00Z
- federalreserve.gov
- reuters.com2026-10-07T14:24:00Z
- reuters.com2026-10-14T00:00:00Z
- fiscaldata.treasury.gov2026-10-02T00:00:00Z
- Yahoo2026-10-14T21:50:00.000Z
- Yahoo2026-10-14T21:50:00.000Z
- Yahoo2026-10-14T21:25:00.000Z
- Yahoo2026-10-14T21:17:06.000Z
- Yahoo2026-10-14T21:03:27.000Z
- Yahoo2026-10-14T20:35:00.000Z
- Yahoo2026-10-14T21:22:00.000Z
- Yahoo2026-10-14T21:15:00.000Z
- Yahoo2026-10-14T21:00:00.000Z
- Yahoo2026-10-14T20:31:00.000Z
- Yahoo2026-10-14T21:48:20.000Z
- Yahoo2026-10-14T21:33:59.000Z
- Yahoo2026-10-14T20:46:00.000Z
- Yahoo2026-10-14T19:59:41.000Z
- Yahoo2026-10-14T18:00:00.000Z
- Yahoo2026-10-14T21:38:54.000Z
- Yahoo2026-10-14T20:39:54.000Z