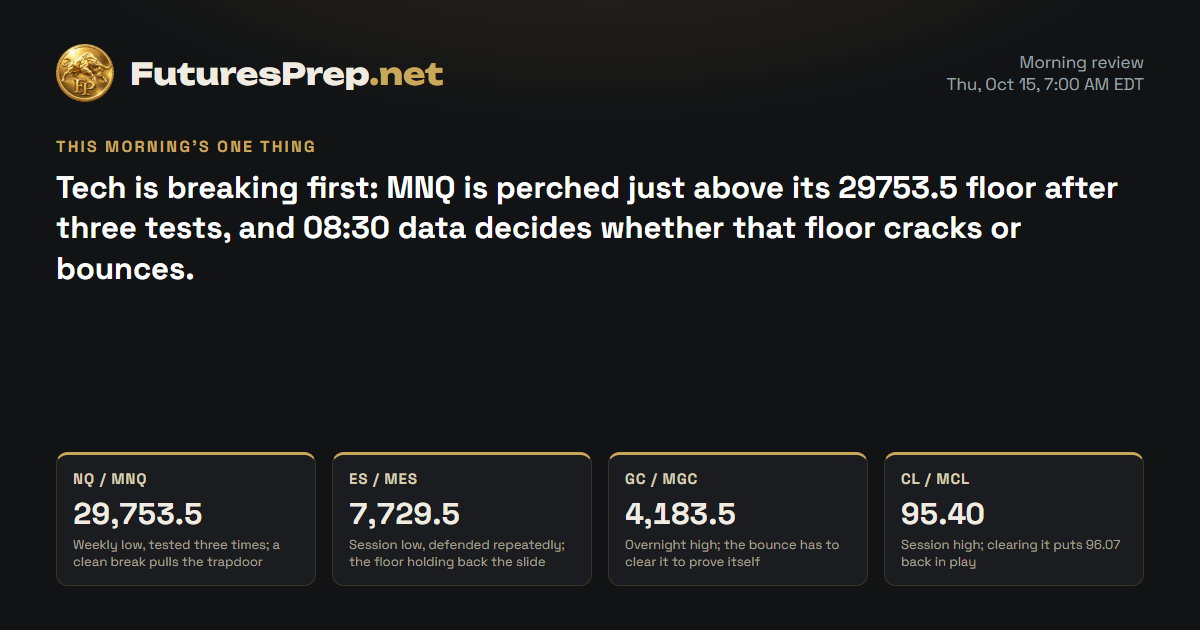
The Lines in the Sand
The Trap
Late bears tend to pile in on the fourth tap of a shelf that has already held three times, then get squeezed when a relief pop rips through them. Bulls who chase that pop below 30035 tend to get caught when the slide resumes.
The Read
Bulls tried to hold last week's low at 30792 and got run over. Price dropped from 30794.5, closed at 30138.75 and is sitting right on top of the 30078.5 weekly low. Volume came in heavy and the hourly chart keeps making lower lows, so this looks like real liquidation, not a thin slip. Hot CPI was the fuel. The best case for the bulls is exhaustion: a day this stretched often snaps back first. The evidence clearly sides with the bears. Hold below 30420 and the pressure stays on; get back above 30420 and stay there, and the downside case weakens fast.
Morning review · Oct 15, 7:30 AM EDT
Bulls who opened the week at 31144.5 are badly offside: price broke and held below the 30792 prior-week low and has dropped all the way to 29753.5. Overnight added another leg lower, and the last hour closed at 29801.25 under its falling average. The counterpoint is plain: three tests of the 29753.5-29787.25 pocket haven't broken through, and the 08:30 PPI and retail sales numbers could flip the tape in either direction. The evidence still clearly sides with the bears; lose 29753.5 and the floor is gone, while sustained trade back above 30035 takes the heat off.
Overnight evidence · 14 cited findings
Overnight price action
- From the prior evening baseline, MNQ traded from a 30159 high to a 29753.5 low and was 349.75 points lower at the last completed bar.
- The prior expected path ended at 29965 by 06:00 ET; the observed 29801.25 close was materially lower but directionally consistent with the bearish read.
- The opening gap to 30138.75 filled before price continued lower.
- Repeated lows near 29753.5-29787.25 produced stabilization rather than a confirmed reversal.
- H1 boundary approximation applies because the overnight measurement begins inside the 18:00 bar.
Overnight events
- No verified scheduled macro release occurred before the 07:30 ET cutoff.
- The 08:30 ET PPI, retail-sales and claims risk falls inside the new morning forecast horizon.
- Driver headlines reported continued AI-related selling despite strong TSMC demand commentary, reinforcing two-sided headline risk.
- No verified Treasury buyback or correctly timed early-morning Fed event is embedded in the projection.
What changed
- Price action preserves the prior bearish direction and owns the read.
- Weekly acceptance below 30792, the daily EMA21 loss and the 349.75-point overnight decline strongly support confidence.
- Constituent weakness adds confirmation without changing direction.
- Repeated support near 29753.5 and event risk reduce certainty but do not overturn the tape.
- Net result: unchanged bearish verdict, with a relief bounce possible before another downside attempt.
Index drivers
| Ticker | Approx. weight | Day move | Next earnings | Top headline |
|---|---|---|---|---|
| NVDA | 8.4% | −3.16% | — | TSMC posts record profit amid 'extremely robust demand' for AI chips |
| MSFT | 5.75% | −1.8% | Oct 28 | Microsoft Had Its Best Quarter in 28 Years. Is it Too Late to Buy the Stock? |
| AAPL | 7.28% | +0.5% | — | Apple Now Faces Its Own Trade-Secret Claims From OpenAI. |
| AMZN | 4.04% | −1.74% | Oct 29 · After close | Update: Market Chatter: Anthropic Revenue Hits $16.8 Billion in Q3, AI-Modeler Cash Flow Positive |
| META | 3.26% | −3.27% | Oct 21 · After close | Meta has an AI advantage OpenAI and Anthropic can't replicate |
| AVGO | 2.47% | −3.1% | — | TSMC Stock Falls After Blowout Earnings. Musk Talks Could Offset AI Chip Fears. |
| GOOGL | 3% | −1.74% | Oct 27 · After close | AEP to invest $4bn in 702MW fuel cell project for Google |
| TSLA | 2.81% | −2.15% | Oct 21 · After close | TSMC posts record profit amid 'extremely robust demand' for AI chips |
Most of the Nasdaq heavyweights closed lower last session. NVIDIA, Meta and Broadcom fell hardest, Microsoft, Amazon, Alphabet and Tesla also slipped, and Apple was the one notable gainer. Meta and Tesla report on October 21 after the close, followed by Alphabet on October 27, Microsoft on October 28 and Amazon on October 29.
Market data as of Oct 15, 7:33 AM EDT · Weights as of 2026-09-30
Evidence · 8 cited findings
Price action · weekly / daily / H1
- Bearish first record: weekly price accepted below the 30792 prior-week low and closed at 30138.75 near the 30078.5 weekly low after declining 1005.75 points from the weekly open.
- The daily candle was a high-volume 1.81-ADR bearish expansion, with an 80.66% body and a close 1.196 ADR below the 30675.93 EMA21.
- H1 remains below its falling EMA21 after successive lower lows; the projected sequence is a reflex bounce toward 30240-30320 followed by renewed pressure.
- The strongest price-action contradiction is exhaustion risk after an unusually large daily range; sustained acceptance above 30420 would weaken continuation odds.
Metrics
- Daily volume was 1.774 times its 30-session average, supporting initiative selling rather than a low-participation break.
- The final completed H1 range was 89 points versus a 105-point expansion threshold, so immediate hourly expansion was not active at the cutoff.
- QQQ-weighted drivers broadly confirmed risk-off pressure: NVDA fell 3.1595%, META 3.2734%, AVGO 3.0954%, MSFT 1.7959%, AMZN 1.7403%, GOOGL 1.7355%, and TSLA 2.1507%; AAPL rose 0.4952% as the principal exception (https://www.invesco.com/qqq-etf/en/about.html).
Sentiment & current events
- September CPI rose 0.6% month over month and 3.7% year over year, while core CPI rose 0.3% and 2.6%; the hot release supports pressure on rate-sensitive growth, though gasoline drove a material portion of the headline increase (https://www.bls.gov/news.release/cpi.nr0.htm?v=20261014).
Sources & evidence dates · 32
- bls.gov2026-10-14T12:30:00Z
- cmegroup.com
- census.gov2026-09-23T00:00:00Z
- dol.gov2026-10-08T00:00:00Z
- federalreserve.gov
- reuters.com2026-10-07T14:24:00Z
- reuters.com2026-10-14T00:00:00Z
- fiscaldata.treasury.gov2026-10-02T00:00:00Z
- Yahoo2026-10-15T10:45:36.000Z
- Yahoo2026-10-15T10:42:56.000Z
- Yahoo2026-10-15T10:25:00.000Z
- Yahoo2026-10-15T08:35:02.000Z
- Yahoo2026-10-15T08:00:00.000Z
- Yahoo2026-10-15T07:18:16.000Z
- Yahoo2026-10-15T09:36:36.000Z
- Yahoo2026-10-15T09:05:00.000Z
- Yahoo2026-10-15T08:30:00.000Z
- Yahoo2026-10-15T08:20:41.000Z
- Yahoo2026-10-15T08:11:28.000Z
- Yahoo2026-10-15T07:00:00.000Z
- Yahoo2026-10-15T10:00:00.000Z
- Yahoo2026-10-15T09:59:31.000Z
- Yahoo2026-10-15T09:50:00.000Z
- Yahoo2026-10-15T08:47:00.000Z
- ChartMill2026-10-15T07:55:32.000Z
- Yahoo2026-10-15T06:16:06.000Z
- Yahoo2026-10-15T08:39:36.000Z
- Yahoo2026-10-15T07:00:00.000Z
- SeekingAlpha2026-10-15T06:46:01.000Z
- Yahoo2026-10-15T10:20:50.000Z
- Yahoo2026-10-15T09:57:14.000Z