Session Prep

Two minutes tonight. A plan tomorrow.
Evening edition · Data as of Mon, Oct 12, 5:00 PM EDT · All times Eastern
Deep research

Tonight's one thing

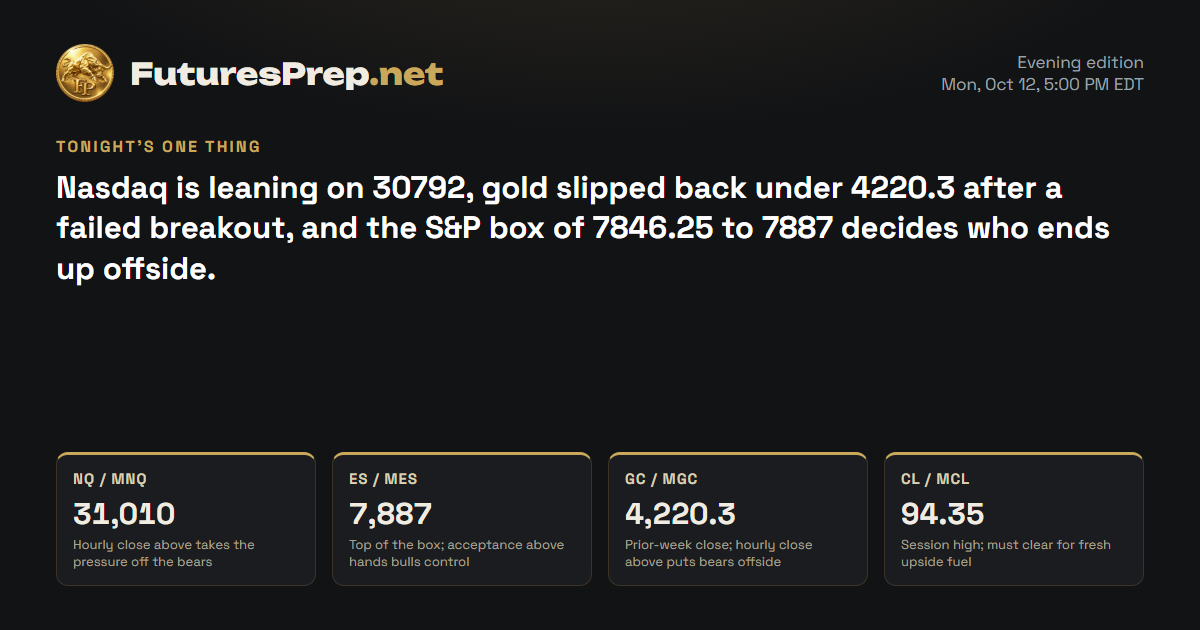
Nasdaq is leaning on 30792, gold slipped back under 4220.3 after a failed breakout, and the S&P box of 7846.25 to 7887 decides who ends up offside.

Tomorrow's market movers · Tuesday, October 13

No major U.S. releases or tracked driver earnings scheduled.

U.S. releases, high and medium impact.

NQ / MNQE-mini / Micro E-mini Nasdaq-100Weekly thesis · STRESSED

The Lines in the Sand

31,010Hourly close above takes the pressure off the bears
30,842.5Session low; a close under opens the trapdoor
30,792Untouched prior-week low, the nearest pool of resting orders

The Trap

Late hourly bars went quiet near the low, and quiet bars tempt traders to lean hard on a breakdown before price actually closes under 30842.5. The other side gets caught too: bottom-pickers jumping in early above 30792 before that floor has been tested.

Last price30,877.5
ADR · 30 sessions439.47 pts
Daily EMA2130,717.42HOLD
Reopen gapNo opening gap
30,80030,90031,00031,10031,20031,30031,40031,50031,600close 16:00Tue 9:30close 16:00Wed 9:30close 16:00Thu 9:30close 16:00Fri 9:30close 16:00Mon 9:30close 16:00Prior week high · 31,616.5Prior week low · 30,792H1 · EMA21 · NQ / MNQ 30,877.5Yellow: 09:30 open · dashed gray: 16:00 close (ET)

The Read

Bulls made a run at 31290 and got thrown back hard. Price sliced under the 31123.25 prior-week close and settled at 30877.5, barely off the 30842.5 low, on heavier-than-usual volume. Bears have the edge, but bulls still have ground under them: the untouched 30792 prior-week low and the 21-day average at 30717.42 sit right below, and the megacaps were split rather than stampeding. Lose 30842.5 and the path to 30792 opens; a completed hourly close back above 31010 and the bears are the ones offside.

Yesterday's daily candle · Mon, Oct 12
Open31,144.5High31,290Low30,842.5Close30,877.5
bearish · range 447.5 pts
Projected range · next session345 pts30,690 – 31,035

Index drivers

Chip heavyweights led the drag, with Nvidia and Broadcom lower and Amazon and Tesla also in the red. Apple, Microsoft and Meta pushed the other way, Meta posting the biggest gain of the group, while Alphabet edged higher. Tesla is scheduled to report earnings on October 20 after the close.

Market data as of Oct 12, 6:33 PM EDT · Weights as of 2026-09-30

Evidence · 9 cited findings

Price action · weekly / daily / H1

  • Weekly structure opened below the 31123.25 prior close, rejected 31290 and settled near the 30842.5 session low; the untaken 30792 prior-week low is the nearest downside liquidity.
  • The 447.5-point bearish daily range used 1.018 ADR on 1.265 times 30-day average volume, while the close remained above the 30717.42 daily EMA21; continuation pressure therefore meets meaningful support at 30792-30717.
  • H1 produced lower highs and lower lows and finished below its 31009.67 H1 EMA21; a close below 30842.5 activates the downside expansion case, while acceptance above 31010 weakens it.

Metrics

  • The bearish session consumed slightly more than one ADR and closed only 35 points above its low, supporting downside control without proving acceptance below weekly support.
  • Large-cap technology drivers were mixed: NVDA fell 1.291%, AMZN 1.1051%, AVGO 1.8836% and TSLA 1.2203%, while AAPL rose 1.2862%, MSFT 1.1363% and META 3.3799%; this limits confirmation from the index leadership snapshot. Source: https://www.invesco.com/qqq-etf/en/about.html
  • The last completed H1 range was only 29.25 points versus a 105-point expansion threshold, so the late compression requires a fresh range break rather than implying that expansion is already underway.

Sentiment & current events

  • Fresh secondary commentary described subdued U.S. equity futures ahead of earnings and inflation data, which is consistent with caution but does not independently establish downside continuation. Source: https://www.kitco.com/news/off-the-wire/2026-10-12/us-stock-futures-steady-oil-jumps-two-week-high-ahead-key-earnings
  • The September CPI release is scheduled for 2026-10-14 at 08:30 ET and the Beige Book for 14:00 ET; neither event falls inside this 12-hour forecast, and their outcomes are unknown. Sources: https://www.bls.gov/schedule/news_release/cpi.htm and https://www.federalreserve.gov/newsevents/2026-october.htm
  • The Columbus Day fixed-income closure and Tuesday release of delayed Federal Reserve statistics can increase repricing risk, but no verified directional outcome is available. Sources: https://www.sifma.org/news/press-releases/sifma-fixed-income-market-close-recommendations-in-the-u-s-the-u-k-and-japan-for-u-s-columbus-day-and-japan-health-and-sports-day-holidays-2026 and https://www.federalreserve.gov/newsevents/2026-october.htm
Sources & evidence dates · 29
  1. bls.gov
  2. The Federal Reserve schedules the Beige Book for Wednesday, 2026-10-14 at 14:00 ET. Its contents and resulting yield or asset-price reactions cannot be known before publication.
  3. sifma.org2026-09-29T00:00:00-04:00
  4. The Federal Reserve calendar states that daily and weekly statistical releases normally scheduled for Columbus Day will be released Tuesday, 2026-10-13.
  5. bls.gov
  6. tradingeconomics.com2026-10-09T00:00:00Z
  7. thenationalnews.com2026-10-09T00:00:00-04:00
  8. kitco.com2026-10-12
  9. cftc.gov2026-10-09
  10. Reddit evidence was stale or absent and is inactive S4 material; it provides no permissible directional evidence for any covered contract.
  11. Yahoo2026-10-12T21:50:00.000Z
  12. Yahoo2026-10-12T21:46:47.000Z
  13. Yahoo2026-10-12T21:33:32.000Z
  14. Yahoo2026-10-12T21:31:00.000Z
  15. Yahoo2026-10-12T21:21:41.000Z
  16. Yahoo2026-10-12T20:53:39.000Z
  17. Yahoo2026-10-12T20:30:00.000Z
  18. Yahoo2026-10-12T21:09:05.000Z
  19. Yahoo2026-10-12T20:54:19.000Z
  20. Yahoo2026-10-12T21:38:04.000Z
  21. Yahoo2026-10-12T21:23:11.000Z
  22. Yahoo2026-10-12T20:47:00.000Z
  23. Yahoo2026-10-12T20:41:08.000Z
  24. Yahoo2026-10-12T20:30:08.000Z
  25. Yahoo2026-10-12T21:15:00.000Z
  26. Yahoo2026-10-12T21:03:00.000Z
  27. Yahoo2026-10-12T20:45:05.000Z
  28. Yahoo2026-10-12T19:30:15.000Z
  29. Yahoo2026-10-12T17:55:00.000Z
ES / MESE-mini / Micro E-mini S&P 500Weekly thesis · STRESSED

The Lines in the Sand

7,887Top of the box; acceptance above hands bulls control
7,846.25Floor of the box; lose it and bears take over
7,760Prior-week low, the weekly floor still intact

The Trap

Tight, sleepy ranges like this lure traders into chasing the first poke through 7846.25 or 7887, only to watch price snap back into the box. With the megacaps split, the break can also come suddenly once one edge finally gives way.

Last price7,857
ADR · 30 sessions74.96 pts
Daily EMA217,794.28HOLD
Reopen gapNo opening gap
7,7807,8007,8207,8407,8607,8807,900close 16:00Tue 9:30close 16:00Wed 9:30close 16:00Thu 9:30close 16:00Fri 9:30close 16:00Mon 9:30close 16:00Prior week high · 7,897.5H1 · EMA21 · ES / MES 7,857Yellow: 09:30 open · dashed gray: 16:00 close (ET)

The Read

Neither side has the S&P by the collar. Price slipped from 7887, stalled above 7846.25 and parked at 7857, still inside last week's 7760 to 7897.5 range. The drop was small, volume was ordinary, and the late hourly bars shrank to almost nothing. Bears have the hourly chart pinned under its short-term average; bulls have price sitting well above the 21-day average at 7794.28. A completed hourly close under 7846.25 tilts the box lower, and acceptance above 7887 hands it to the bulls.

Yesterday's daily candle · Mon, Oct 12
Open7,872.5High7,887Low7,846.25Close7,857
bearish · range 40.75 pts
Projected range · next session44 pts7,834 – 7,878
⚠ Flat / choppy conditions likely

Index drivers

Chipmakers did the damage, with Micron falling hardest and Nvidia, AMD and Broadcom also lower alongside Amazon and Tesla. Apple, Microsoft, Meta, both Alphabet share classes and Berkshire Hathaway finished higher. Tesla is scheduled to report earnings on October 20 after the close.

Market data as of Oct 12, 6:33 PM EDT · Weights as of 2026-10-01

Evidence · 9 cited findings

Price action · weekly / daily / H1

  • Weekly price remains inside the prior-week 7760-7897.5 range after failing below 7887, leaving no confirmed higher-timeframe breakout and only a modest red weekly body.
  • The daily candle closed bearish but used only 0.544 ADR and remains 62.72 points above the 7794.28 daily EMA21, so the decline lacks the range and structural damage required for a strong bearish read.
  • H1 is below its 7861.08 EMA21 and carries intraday lower highs, but late trade stabilized above 7846.25; balance between 7846.25 and 7887 is favored until closing acceptance develops outside it.

Metrics

  • The daily range was 40.75 points versus a 74.96-point ADR, while volume was 0.99 times its 30-day average; neither measure identifies decisive initiative control.
  • The final H1 range was 4.25 points versus an 18.5-point expansion threshold, confirming compression rather than active expansion.
  • Major S&P 500 drivers were split: NVDA, AMZN, AVGO, MU and AMD declined while AAPL, MSFT, META and both Alphabet classes advanced, supporting a balanced rather than unified index signal. Source: https://www.ssga.com/us/en/intermediary/etfs/state-street-spdr-sp-500-etf-trust-spy

Sentiment & current events

  • Fresh secondary commentary reported subdued equity futures ahead of earnings and inflation data, but it does not verify a directional break from balance. Source: https://www.kitco.com/news/off-the-wire/2026-10-12/us-stock-futures-steady-oil-jumps-two-week-high-ahead-key-earnings
  • The September CPI release is scheduled for 2026-10-14 at 08:30 ET and the Beige Book at 14:00 ET; both sit beyond this forecast and their reactions are unknowable. Sources: https://www.bls.gov/schedule/news_release/cpi.htm and https://www.federalreserve.gov/newsevents/2026-october.htm
  • Tuesday may include delayed Federal Reserve statistical releases after the Columbus Day fixed-income closure, increasing event risk without providing a verified direction. Sources: https://www.sifma.org/news/press-releases/sifma-fixed-income-market-close-recommendations-in-the-u-s-the-u-k-and-japan-for-u-s-columbus-day-and-japan-health-and-sports-day-holidays-2026 and https://www.federalreserve.gov/newsevents/2026-october.htm
Sources & evidence dates · 37
  1. bls.gov
  2. The Federal Reserve schedules the Beige Book for Wednesday, 2026-10-14 at 14:00 ET. Its contents and resulting yield or asset-price reactions cannot be known before publication.
  3. sifma.org2026-09-29T00:00:00-04:00
  4. The Federal Reserve calendar states that daily and weekly statistical releases normally scheduled for Columbus Day will be released Tuesday, 2026-10-13.
  5. bls.gov
  6. tradingeconomics.com2026-10-09T00:00:00Z
  7. thenationalnews.com2026-10-09T00:00:00-04:00
  8. kitco.com2026-10-12
  9. cftc.gov2026-10-09
  10. Reddit evidence was stale or absent and is inactive S4 material; it provides no permissible directional evidence for any covered contract.
  11. Yahoo2026-10-12T21:50:00.000Z
  12. Yahoo2026-10-12T21:46:47.000Z
  13. Yahoo2026-10-12T21:33:32.000Z
  14. Yahoo2026-10-12T21:31:00.000Z
  15. Yahoo2026-10-12T21:21:41.000Z
  16. Yahoo2026-10-12T20:53:39.000Z
  17. Yahoo2026-10-12T20:30:00.000Z
  18. Yahoo2026-10-12T21:09:05.000Z
  19. Yahoo2026-10-12T20:54:19.000Z
  20. Yahoo2026-10-12T21:38:04.000Z
  21. Yahoo2026-10-12T21:23:11.000Z
  22. Yahoo2026-10-12T20:47:00.000Z
  23. Yahoo2026-10-12T20:41:08.000Z
  24. Yahoo2026-10-12T20:30:08.000Z
  25. Yahoo2026-10-12T21:15:00.000Z
  26. Yahoo2026-10-12T21:03:00.000Z
  27. Yahoo2026-10-12T20:45:05.000Z
  28. Yahoo2026-10-12T19:30:15.000Z
  29. Yahoo2026-10-12T17:55:00.000Z
  30. Yahoo2026-10-12T21:20:54.000Z
  31. Yahoo2026-10-12T20:51:19.000Z
  32. Yahoo2026-10-12T20:45:02.000Z
  33. Yahoo2026-10-12T19:50:00.000Z
  34. Yahoo2026-10-12T19:47:08.000Z
  35. Yahoo2026-10-12T10:20:00.000Z
  36. Yahoo2026-10-12T10:00:00.000Z
  37. Yahoo2026-10-12T09:26:02.000Z
GC / MGCGold / Micro GoldWeekly thesis · STRESSED

The Lines in the Sand

4,220.3Prior-week close; hourly close above puts bears offside
4,178Session low; a close below fuels the next leg down
4,091.2Untaken prior-week low and the deeper weekly floor

The Trap

The failed push above 4233.5 caught breakout chasers holding the top. Now price is coiled just above 4178, where late shorts tend to pile in on the first dip, right into the path of any rebound.

Last price4,195.9
ADR · 30 sessions93.17 pts
Daily EMA214,252.25REJECT
Reopen gapNo opening gap
4,1004,1204,1404,1604,1804,2004,2204,240close 13:30Tue 8:20close 13:30Wed 8:20close 13:30Thu 8:20close 13:30Fri 8:20close 13:30Mon 8:20close 13:30Prior week high · 4,233.5Prior week low · 4,091.2H1 · EMA21 · GC / MGC 4,195.9Yellow: 08:20 open · dashed gray: 13:30 close (ET)

The Read

Gold bulls pushed through last week's 4233.5 high, but the move didn't stick. Price was thrown back from 4242.3 and closed at 4195.9, under both the 4221 weekly open and the 4220.3 prior-week close. The daily candle stalled below its 21-day average at 4252.25, and the hourly chart printed lower highs all the way down. Close under 4178 and the next real floor is 4091.2; reclaim 4220.3 on an hourly close and the bears are offside.

Yesterday's daily candle · Mon, Oct 12
Open4,221High4,242.3Low4,178Close4,195.9
bearish · range 64.3 pts
Projected range · next session62 pts4,158 – 4,220
Evidence · 9 cited findings

Price action · weekly / daily / H1

  • Weekly price swept the 4233.5 prior-week high but failed to accept above it and closed below the 4221 weekly open, favoring rotation toward lower weekly support.
  • The daily candle rejected its 4252.25 EMA21 and closed bearish at 4195.9, below both the weekly open and 4220.3 prior-week close.
  • H1 formed persistent lower highs from 4242.3 and finished below its 4199.04 EMA21; a close below 4178 activates continuation, while a close above 4220.3 invalidates immediate downside control.

Metrics

  • The daily range used 0.69 ADR and closed 56.35 points below the daily EMA21, supporting bearish structure, although volume was only 0.67 times the 30-day average.
  • The final H1 range was 4.7 points versus a 23.9-point expansion threshold, leaving price compressed near 4196 ahead of the 4178 trigger.
  • The weekly arithmetic still permits the recorded bullish weekly view because only 25.1 points were required by its original arithmetic check, but that feasibility calculation does not override the failed breakout or current bearish direction.

Sentiment & current events

  • Supplied gold ETF-flow, central-bank-purchase, positioning, dollar and Treasury-yield claims were not independently reproduced from primary official datasets and cannot validate a one-session direction. Source: https://www.gold.org/goldhub/research/gold-etfs-holdings-and-flows/2026/10
  • CPI is scheduled for 2026-10-14 at 08:30 ET and the Beige Book for 14:00 ET; their outcomes and gold reactions are unknown. Sources: https://www.bls.gov/schedule/news_release/cpi.htm and https://www.federalreserve.gov/newsevents/2026-october.htm
  • The Columbus Day fixed-income closure and Tuesday statistical-release catch-up create yield and dollar repricing risk, but no verified directional response is available. Sources: https://www.sifma.org/news/press-releases/sifma-fixed-income-market-close-recommendations-in-the-u-s-the-u-k-and-japan-for-u-s-columbus-day-and-japan-health-and-sports-day-holidays-2026 and https://www.federalreserve.gov/newsevents/2026-october.htm
Sources & evidence dates · 10
  1. bls.gov
  2. The Federal Reserve schedules the Beige Book for Wednesday, 2026-10-14 at 14:00 ET. Its contents and resulting yield or asset-price reactions cannot be known before publication.
  3. sifma.org2026-09-29T00:00:00-04:00
  4. The Federal Reserve calendar states that daily and weekly statistical releases normally scheduled for Columbus Day will be released Tuesday, 2026-10-13.
  5. bls.gov
  6. tradingeconomics.com2026-10-09T00:00:00Z
  7. gold.org2026-10-07
  8. thenationalnews.com2026-10-09T00:00:00-04:00
  9. cftc.gov2026-10-09
  10. Reddit evidence was stale or absent and is inactive S4 material; it provides no permissible directional evidence for any covered contract.
CL / MCLWTI Crude Oil / Micro WTI Crude OilWeekly thesis · FULFILLED

The Lines in the Sand

94.35Session high; must clear for fresh upside fuel
93.2Old weekly high, now the breakout's proving ground
92.7Hourly close below turns the breakout into a pullback

The Trap

Breakouts above an old weekly high attract late chasers, and this one slid back to 93.2 after tagging 94.35, leaving those latecomers offside. Bears who fought the move too early were run over by the demand that showed up at 89.61.

Last price93.18
ADR · 30 sessions4.1 pts
Daily EMA2191.17HOLD
Reopen gapNo opening gap
878889909192939495close 14:30Tue 9:00close 14:30Wed 9:00close 14:30Thu 9:00close 14:30Fri 9:00close 14:30Mon 9:00close 14:30Prior week high · 93.2Prior week low · 86.85H1 · EMA21 · CL / MCL 93.18Yellow: 09:00 open · dashed gray: 14:30 close (ET)

The Read

Oil bulls punched through last week's 93.2 high and ran to 94.35, then lost their grip and closed at 93.18, right on the line. Demand showed up hard at 89.61, and price holds above its 21-day average at 91.17 on above-average volume. The upper wick is the warning: the day already burned more than its usual range, and the hourly bars have gone quiet. Hold 92.70 to 93.2 and the door back to 94.35 stays open; an hourly close under 92.70 and the breakout starts to look like the trap.

Yesterday's daily candle · Mon, Oct 12
Open91.83High94.35Low89.61Close93.18
bullish · range 4.74 pts
Projected range · next session2.6 pts92.45 – 95.05
Evidence · 8 cited findings

Price action · weekly / daily / H1

  • Weekly price traded through the 93.2 prior-week high and closed nearly on that level, preserving a green weekly body despite lacking confirmed acceptance above the breakout boundary.
  • The daily candle reclaimed and held above the 91.17 EMA21 during a 1.156-ADR bullish session on 1.231 times average volume; the 89.61 rejection shows responsive demand, while the upper wick warns of exhaustion.
  • H1 remains above its rising 92.73 EMA21 after an impulsive advance, but momentum cooled from 94.35 into the close; holding 92.70-93.20 supports continuation, while a close below 92.70 favors deeper retracement.

Metrics

  • The 4.74-point daily range exceeded the 4.1-point ADR and closed 2.01 points above the daily EMA21, supporting bullish control but also showing that substantial range has already been spent.
  • The final H1 range contracted to 0.22 versus a 0.82 expansion threshold only two bars after the last expansion, making 94.35 the required confirmation for renewed upside acceleration.
  • Monday’s 94.35 high exceeded the Sunday 93.2-94.1 overshoot zone before closing back near 93.2, confirming thesis fulfillment while increasing failed-breakout risk.

Sentiment & current events

  • Fresh secondary commentary placed oil near a two-week high, but it does not independently verify continuation. Source: https://www.kitco.com/news/off-the-wire/2026-10-12/us-stock-futures-steady-oil-jumps-two-week-high-ahead-key-earnings
  • The claimed 2026-10-15 EIA release date conflicts with EIA’s published Columbus Day schedule pointing to 2026-10-14; exact product-specific timing still requires confirmation. Source: https://www.eia.gov/petroleum/gasdiesel/schedule.php
Sources & evidence dates · 13
  1. bls.gov
  2. The Federal Reserve schedules the Beige Book for Wednesday, 2026-10-14 at 14:00 ET. Its contents and resulting yield or asset-price reactions cannot be known before publication.
  3. eia.gov
  4. nhc.noaa.gov2026-10-12T14:00:00-04:00
  5. bls.gov
  6. tradingeconomics.com2026-10-09T00:00:00Z
  7. forexfactory.com
  8. eia.gov2026-10-07
  9. opec.org
  10. thenationalnews.com2026-10-09T00:00:00-04:00
  11. kitco.com2026-10-12
  12. cftc.gov2026-10-09
  13. Reddit evidence was stale or absent and is inactive S4 material; it provides no permissible directional evidence for any covered contract.

Free. Always. Futures trading edge in your inbox.

You're in. Watch your inbox.

We do not send junk mail. We do not spam.