Session Prep

Two minutes tonight. A plan tomorrow.
Evening edition · Data as of Fri, Oct 9, 5:00 PM EDT · All times Eastern
Deep research

Tonight's one thing

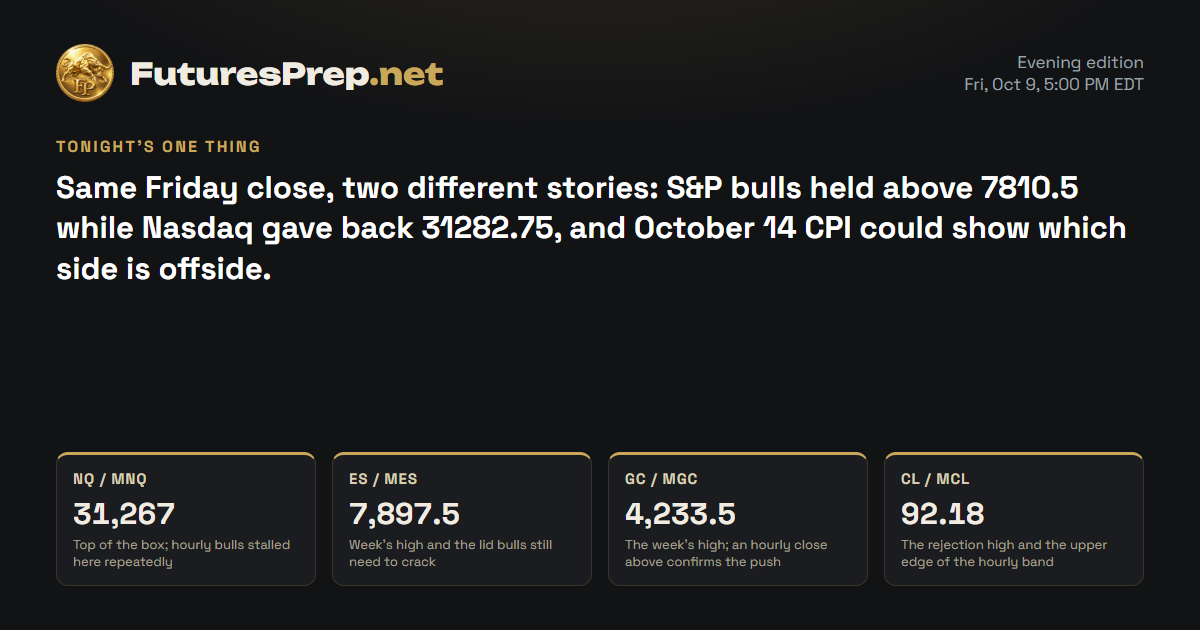
Same Friday close, two different stories: S&P bulls held above 7810.5 while Nasdaq gave back 31282.75, and October 14 CPI could show which side is offside.

Tomorrow's market movers · Monday, October 12

No major U.S. releases or tracked driver earnings scheduled.

U.S. releases, high and medium impact.

NQ / MNQE-mini / Micro E-mini Nasdaq-100Weekly thesis · INTACT

The Lines in the Sand

31,267Top of the box; hourly bulls stalled here repeatedly
30,982.75Bottom of the balance band; losing it tilts control lower
30,792Last week's low and the structural floor under everything

The Trap

The crowd that chased last week's push through 31282.75 got left holding it when price slid back to 31123.25. Inside a balance box, breakouts that look clean at the edge tend to fold back into the middle.

Last price31,123.25
ADR · 30 sessions437.03 pts
Daily EMA2130,696.32HOLD
Reopen gapNo opening gap
30,80030,90031,00031,10031,20031,30031,40031,50031,600close 16:00Mon 9:30close 16:00Tue 9:30close 16:00Wed 9:30close 16:00Thu 9:30close 16:00Fri 9:30close 16:00Prior week high · 31,282.75H1 · EMA21 · NQ / MNQ 31,123.25Yellow: 09:30 open · dashed gray: 16:00 close (ET)

The Read

Bulls broke through last week's 31282.75 high, ran up to 31616.5 and then got rejected hard, so the break did not hold into the close. The week finished as a doji at 31123.25, a stalemate where neither side kept control. On the hourly chart, the bounce off 30792 stalled near a flat 31127.16 average, and price is boxed between 30982.75 and 31267. The bull case still has one point in its favor: the daily close sits well above the 30696.32 average. CPI on October 14 and TSMC on October 15 bring event risk without a known direction. An hourly close above 31267 puts 31282.75 back in play; if 30982.75 gives way, 30792 is the floor that matters.

Yesterday's daily candle · Fri, Oct 9
Open31,022.75High31,267Low30,952.25Close31,123.25
bullish · range 314.75 pts
Projected range · next session355 pts30,955 – 31,310
⚠ Flat / choppy conditions likely

Index drivers

At the October 9 close, Microsoft and Amazon both rose clearly while Apple, Nvidia and Meta slipped, so the heavyweights split rather than moving together. Those quotes are from Friday and say nothing about Sunday's tape. Tesla is the next big name scheduled to post earnings, on October 20 after the close.

Market data as of Oct 11, 6:33 PM EDT · Weights as of 2026-09-30

Evidence · 11 cited findings

Price action · weekly / daily / H1

  • Flat is the first and controlling record: weekly acceptance above 31282.75 did not hold into the 31123.25 close, and rejection from 31616.5 left two-sided control while 30792 remained intact.
  • The daily close remained 0.98 ADR above the 30696.32 EMA21, but the bullish candle used only 0.72 ADR and finished below 31267 resistance.
  • H1 recovered from 30792 but stalled around its nearly flat 31127.16 EMA21; the operative balance range is 30982.75-31267.
  • The projected overnight scenario rotates from 31155 toward 31065 before recovering toward 31205, with a projected 31130/31310/30955/31195 candle.

Metrics

  • The weekly candle spanned 824.5 points and closed as a doji, supporting balance rather than directional acceptance.
  • The last completed H1 range was 35.5 points versus a 105-point expansion threshold, and six bars had elapsed since expansion.
  • QQQ driver performance was split at the October 9 close: MSFT +2.38% and AMZN +3.29% contrasted with AAPL -1.11% and NVDA -0.52%; weights source: https://www.invesco.com/qqq-etf/en/about.html
  • Driver quotes are dated October 9 and cannot establish current Sunday-session momentum.

Sentiment & current events

  • TSMC's third-quarter conference is scheduled for October 15 at 02:00 ET, creating semiconductor event risk without a verifiable advance direction: https://investor.tsmc.com/english/quarterly-results/2026/q3
  • The verified 3.75%-4.00% policy-rate regime is a valuation headwind, but its next equity reaction is not predetermined: https://www.federalreserve.gov/newsevents/pressreleases/monetary20260916a.htm
  • Exact COT positioning was not reproduced from primary CFTC files and is excluded from direction: https://www.cftc.gov/MarketReports/CommitmentsofTraders/index.htm
Sources & evidence dates · 22
  1. bls.gov
  2. investor.tsmc.com
  3. federalreserve.gov2026-09-16
  4. bsee.gov
  5. The exact supplied COT values for NQ, ES, GC, and CL could not be independently reproduced from an accessible primary CFTC report. FuturesBench is a secondary transformation, and COT observations dated October 6 are not current-session positioning.
  6. Yahoo2026-10-11T21:35:00.000Z
  7. Yahoo2026-10-11T21:25:00.000Z
  8. Yahoo2026-10-11T21:16:12.000Z
  9. Yahoo2026-10-11T20:14:00.000Z
  10. Yahoo2026-10-11T17:00:28.000Z
  11. Yahoo2026-10-11T16:08:51.000Z
  12. SeekingAlpha2026-10-11T17:50:00.000Z
  13. Yahoo2026-10-11T13:30:00.000Z
  14. Yahoo2026-10-11T21:33:00.000Z
  15. Yahoo2026-10-11T20:00:18.000Z
  16. Yahoo2026-10-11T14:47:32.000Z
  17. Yahoo2026-10-11T16:50:00.000Z
  18. Yahoo2026-10-11T13:45:15.000Z
  19. Yahoo2026-10-11T18:50:00.000Z
  20. Yahoo2026-10-11T21:00:00.000Z
  21. Yahoo2026-10-11T20:33:00.000Z
  22. Yahoo2026-10-11T20:06:22.000Z
ES / MESE-mini / Micro E-mini S&P 500Weekly thesis · INTACT

The Lines in the Sand

7,897.5Week's high and the lid bulls still need to crack
7,840Bottom of the shelf that has been holding continuation
7,760Week's low; below it the whole breakout comes apart

The Trap

Bears keep fading the quiet hourly drift under 7897.5 and keep getting dragged higher, the same way they did at 7810.5. On the other side, late longs who chase near the lid tend to get shaken out when price dips back into the 7840-7848 shelf.

Last price7,866.25
ADR · 30 sessions75.97 pts
Daily EMA217,787.13HOLD
Reopen gapNo opening gap
7,7607,7807,8007,8207,8407,8607,8807,900close 16:00Mon 9:30close 16:00Tue 9:30close 16:00Wed 9:30close 16:00Thu 9:30close 16:00Fri 9:30close 16:00Prior week high · 7,810.5H1 · EMA21 · ES / MES 7,866.25Yellow: 09:30 open · dashed gray: 16:00 close (ET)

The Read

Bears guarded last week's 7810.5 high and lost it. Price pushed through, held above it and closed the week at 7866.25, not far below the 7897.5 extreme. The daily candle was almost entirely body, closed well above the 7787.13 average and came on 1.30 times normal volume, which is the fuel behind the move. The biggest argument against the bulls is the backdrop of elevated policy rates, with JPMorgan results on October 13 and CPI on October 14 as live wires. If the 7840-7848 shelf holds, 7897.5 is the door to test, and the 7920-7950 overshoot zone sits beyond it. If 7760 breaks, the week's progress is undone.

Yesterday's daily candle · Fri, Oct 9
Open7,821High7,870.75Low7,817Close7,866.25
bullish · range 53.75 pts
Projected range · next session65 pts7,845 – 7,910

Index drivers

At the October 9 close, Microsoft, Amazon and Alphabet all rose, while Apple, Nvidia and AMD slipped, a mixed tape that leaned mildly constructive. Those quotes are from Friday and do not confirm Sunday momentum. Tesla is scheduled to post earnings on October 20 after the close.

Market data as of Oct 11, 6:33 PM EDT · Weights as of 2026-10-01

Evidence · 12 cited findings

Price action · weekly / daily / H1

  • Bullish is the first and controlling record: the completed weekly candle accepted above the prior 7810.5 high and closed at 7866.25 near the 7897.5 weekly extreme.
  • The daily candle had an 84% bullish body and closed 1.04 ADR above the 7787.13 EMA21 on 1.30 times 30-day average volume.
  • H1 advanced from 7783 to 7870.75 and closed at 7866.25 above its 7848.42 EMA21; 7840-7848 is the immediate continuation shelf and 7897.5 is the principal cap.
  • The projected overnight scenario dips from 7869 toward 7857 before advancing toward 7882, with a projected 7867/7910/7845/7894 candle.

Metrics

  • The weekly range was 137.5 points and finished 105.5 points above its open, confirming a GREEN weekly structure.
  • The last H1 range was 7.25 points versus an 18.5-point expansion threshold; a close above 7871 would support renewed expansion.
  • SPY drivers were mixed but net constructive among several heavyweights at the October 9 close: MSFT +2.38%, AMZN +3.29% and GOOGL +0.97% versus AAPL -1.11% and NVDA -0.52%; weights source: https://www.ssga.com/us/en/intermediary/etfs/state-street-spdr-sp-500-etf-trust-spy
  • Driver quotes are dated October 9 and do not independently confirm current Sunday momentum.

Sentiment & current events

  • JPMorgan scheduled third-quarter results for approximately 07:00 ET and its read for 08:30 ET on October 13: https://www.jpmorganchase.com/ir/news/2026/jpmc-to-host-third-quarter-2026-earnings-read
  • TSMC's October 15 conference is relevant to broad technology risk but cannot be assigned an advance direction: https://investor.tsmc.com/english/quarterly-results/2026/q3
  • The 3.75%-4.00% policy-rate regime is the strongest macro contradiction to the bullish price action structure: https://www.federalreserve.gov/newsevents/pressreleases/monetary20260916a.htm
  • Exact COT values were not reproduced from primary CFTC files: https://www.cftc.gov/MarketReports/CommitmentsofTraders/index.htm
Sources & evidence dates · 28
  1. bls.gov
  2. JPMorgan Chase scheduled its third-quarter results for approximately 07:00 ET and earnings read for 08:30 ET on Tuesday, October 13, 2026.2026-09-17
  3. investor.tsmc.com
  4. federalreserve.gov2026-09-16
  5. bsee.gov
  6. The exact supplied COT values for NQ, ES, GC, and CL could not be independently reproduced from an accessible primary CFTC report. FuturesBench is a secondary transformation, and COT observations dated October 6 are not current-session positioning.
  7. Yahoo2026-10-11T21:35:00.000Z
  8. Yahoo2026-10-11T21:25:00.000Z
  9. Yahoo2026-10-11T21:16:12.000Z
  10. Yahoo2026-10-11T20:14:00.000Z
  11. Yahoo2026-10-11T17:00:28.000Z
  12. Yahoo2026-10-11T16:08:51.000Z
  13. SeekingAlpha2026-10-11T17:50:00.000Z
  14. Yahoo2026-10-11T13:30:00.000Z
  15. Yahoo2026-10-11T21:33:00.000Z
  16. Yahoo2026-10-11T20:00:18.000Z
  17. Yahoo2026-10-11T14:47:32.000Z
  18. Yahoo2026-10-11T16:50:00.000Z
  19. Yahoo2026-10-11T13:45:15.000Z
  20. Yahoo2026-10-11T18:50:00.000Z
  21. Yahoo2026-10-11T21:00:00.000Z
  22. Yahoo2026-10-11T20:33:00.000Z
  23. Yahoo2026-10-11T20:06:22.000Z
  24. Yahoo2026-10-11T19:47:06.000Z
  25. SeekingAlpha2026-10-11T13:29:00.000Z
  26. Yahoo2026-10-11T16:03:47.000Z
  27. Yahoo2026-10-11T15:07:44.000Z
  28. SeekingAlpha2026-10-11T16:07:16.000Z
GC / MGCGold / Micro GoldWeekly thesis · INTACT

The Lines in the Sand

4,233.5The week's high; an hourly close above confirms the push
4,193The near floor; losing it weakens the rebound
4,091.2The sweep low; below it the recovery is broken

The Trap

Shorts that pressed below the old 4143 low ran into a fast reclaim and were left offside. Late longs tend to forget that the daily average at 4257.73 still sits overhead like a ceiling.

Last price4,220.3
ADR · 30 sessions97.4 pts
Daily EMA214,257.73REJECT
Reopen gapNo opening gap
4,1004,1204,1404,1604,1804,2004,2204,240close 13:30Mon 8:20close 13:30Tue 8:20close 13:30Wed 8:20close 13:30Thu 8:20close 13:30Fri 8:20close 13:30Prior week low · 4,143H1 · EMA21 · GC / MGC 4,220.3Yellow: 08:20 open · dashed gray: 13:30 close (ET)

The Read

Bears cracked last week's 4143 low and drove price down to 4091.2, but they could not hold it. Bulls took the level back and closed the week at 4220.3, with a solid daily body from 4159.5. The tell against them is that price still sits below the daily 4257.73 average, and volume was light at 0.79 times normal. Underneath, global gold ETFs took in US$10 billion in September, which shows real demand even though it gives no timing signal. An hourly close above 4233.5 opens the door toward 4320; losing 4193 takes the footing out from under the rebound, and 4091.2 is the last floor.

Yesterday's daily candle · Fri, Oct 9
Open4,159.5High4,233.5Low4,156.2Close4,220.3
bullish · range 77.3 pts
Projected range · next session73 pts4,195 – 4,268
Evidence · 12 cited findings

Price action · weekly / daily / H1

  • Bullish is the first and controlling record: the weekly candle swept 4091.2, reclaimed the prior 4143 low and closed at 4220.3, although the repair remains incomplete below 4320.
  • The daily candle formed a 79% bullish body from 4159.5 to 4220.3 but still closed 37.43 points below the 4257.73 EMA21.
  • H1 held above its rising 4205.57 EMA21 after reversing from 4091.2; compression below 4233.5 favors another upside test while 4200 holds, whereas loss of 4193 would weaken continuation.
  • The projected overnight scenario eases from 4216 toward 4203 before reaching 4238, with a projected 4221/4268/4195/4252 candle.

Metrics

  • The completed weekly candle gained 50.9 points from open to close after a 142.3-point range.
  • The daily range used 0.79 ADR, while volume was only 0.79 times its 30-day average, tempering the rebound's confirmation.
  • The last H1 range was 3.6 points versus a 23.9-point expansion threshold, with 15 bars since expansion.
  • Global physically backed gold ETFs attracted US$10 billion in September and US$31 billion during the quarter, corroborating investment demand without guaranteeing price appreciation: https://www.gold.org/goldhub/research/gold-etfs-holdings-and-flows/2026/10

Sentiment & current events

  • Verified gold ETF inflows support the bullish thesis but are not a timing signal: https://www.gold.org/goldhub/research/gold-etfs-holdings-and-flows/2026/10
  • September CPI is scheduled for October 14 at 08:30 ET; its directional effect on gold is conditional rather than automatic: https://www.bls.gov/schedule/news_release/cpi.htm
  • The 3.75%-4.00% policy-rate regime and price below the daily EMA21 oppose immediate continuation: https://www.federalreserve.gov/newsevents/pressreleases/monetary20260916a.htm
  • Exact gold COT exposure was not reproduced from primary CFTC files and is excluded: https://www.cftc.gov/MarketReports/CommitmentsofTraders/index.htm
Sources & evidence dates · 4
  1. bls.gov
  2. federalreserve.gov2026-09-16
  3. Global physically backed gold ETFs attracted US$10 billion in September 2026 and US$31 billion during the quarter, with every region recording inflows. This corroborates investment demand supporting MGC, although it does not guarantee continued price appreciation.2026-10-07
  4. The exact supplied COT values for NQ, ES, GC, and CL could not be independently reproduced from an accessible primary CFTC report. FuturesBench is a secondary transformation, and COT observations dated October 6 are not current-session positioning.
CL / MCLWTI Crude Oil / Micro WTI Crude OilWeekly thesis · INTACT

The Lines in the Sand

92.18The rejection high and the upper edge of the hourly band
90.58The bottom of the band where reversals keep starting
86.85Last week's flush low and the structural floor

The Trap

Breakouts inside 90.58-92.18 keep reversing, and anyone who chases a move to either edge tends to get whipsawed back to the middle. Bears who pressed the break of 88.07 last week found it reclaimed almost at once.

Last price91.67
ADR · 30 sessions3.99 pts
Daily EMA2190.98HOLD
Reopen gapNo opening gap
87888990919293close 14:30Mon 9:00close 14:30Tue 9:00close 14:30Wed 9:00close 14:30Thu 9:00close 14:30Fri 9:00close 14:30Prior week low · 88.07H1 · EMA21 · CL / MCL 91.67Yellow: 09:00 open · dashed gray: 14:30 close (ET)

The Read

Bears flushed oil through last week's 88.07 low down to 86.85, then bulls reclaimed it and dragged price all the way back. The week closed at 91.67, almost exactly at its 91.73 open, after a wide swing between 86.85 and 93.20, a doji with no clear winner. The daily close held above the 90.98 average on heavy volume, but price got turned away at 92.18. A 3.2 million barrel inventory draw and an OPEC+ hold on output help the bulls, while inventories that remain higher than a year ago are the counterweight. An hourly close above 92.18 puts 93.20 back on the table; a close below 90.58 hands the band back to the bears.

Yesterday's daily candle · Fri, Oct 9
Open91.32High92.18Low90.02Close91.67
bullish · range 2.16 pts
Projected range · next session1.9 pts90.55 – 92.45
⚠ Flat / choppy conditions likely
Evidence · 13 cited findings

Price action · weekly / daily / H1

  • Flat is the first and controlling record: the weekly candle swept the prior 88.07 low, reclaimed it and closed at 91.67, almost exactly at its 91.73 open, leaving a broad 86.85-93.20 rejection range.
  • The daily close held above the 90.98 EMA21 on 1.25 times average volume, but its body was only 16% of the range and price rejected from 92.18.
  • H1 remained above its rising 91.23 EMA21 after recovering from 90.02, yet repeated reversals inside 90.58-92.18 favor rotation until an hourly close escapes that band.
  • The projected overnight scenario declines from 91.48 toward 90.95 before recovering to 91.82, with a projected 91.62/92.45/90.55/91.88 candle.

Metrics

  • The completed weekly range was 6.35 points but produced only a 0.06-point open-to-close loss, confirming indecision.
  • The last H1 range was 0.50 versus a 0.82 expansion threshold, with two bars since expansion.
  • EIA reported commercial crude inventories at 424.1 million barrels, down 3.2 million week over week but up 0.9% year over year: https://www.eia.gov/petroleum/supply/weekly/archive/2026/2026_10_07/pdf/table1.pdf
  • OPEC's October 4 release said seven participating countries maintained September required production for November: https://www.opec.org/pr-detail/616-4-october-2026.html
  • The claimed 62.9% Gulf shut-in was contradicted by the discoverable official 25.08% figure and is excluded: https://www.bsee.gov/newsroom/latest-news/statements-and-releases/press-releases/mma-monitors-gulf-response-isaias

Sentiment & current events

  • The verified EIA draw supports crude, while year-over-year inventory growth prevents a one-sided bullish inference: https://www.eia.gov/petroleum/supply/weekly/archive/2026/2026_10_07/pdf/table1.pdf
  • The OPEC+ production hold is supportive relative to an increase but does not verify compliance or demand strength: https://www.opec.org/pr-detail/616-4-october-2026.html
  • The larger Gulf shut-in estimate is excluded because it conflicts with the official discoverable figure: https://www.bsee.gov/newsroom/latest-news/statements-and-releases/press-releases/mma-monitors-gulf-response-isaias
  • Exact crude COT exposure was not reproduced from primary CFTC data: https://www.cftc.gov/MarketReports/CommitmentsofTraders/index.htm
Sources & evidence dates · 6
  1. bls.gov
  2. EIA reported U.S. commercial crude inventories excluding the SPR at 424.1 million barrels for the week ended October 2, down 3.2 million barrels week over week and up 0.9% year over year.2026-10-07
  3. opec.org2026-10-04
  4. bsee.gov
  5. The exact supplied COT values for NQ, ES, GC, and CL could not be independently reproduced from an accessible primary CFTC report. FuturesBench is a secondary transformation, and COT observations dated October 6 are not current-session positioning.
  6. reddit.com2026-10-09

Free. Always. Futures trading edge in your inbox.

You're in. Watch your inbox.

We do not send junk mail. We do not spam.