The Lines in the Sand
The Trap
The trap is chasing the slide after the gap fill, right into a daily trend that still points up. Just as common: calling every weak bounce the bottom while hourly closes stay under their average.
The Read
Bulls broke through last week's 31282.75 high, ran up to 31616.5 and then got rejected hard, so the break did not hold into the close. The week finished as a doji at 31123.25, a stalemate where neither side kept control. On the hourly chart, the bounce off 30792 stalled near a flat 31127.16 average, and price is boxed between 30982.75 and 31267. The bull case still has one point in its favor: the daily close sits well above the 30696.32 average. CPI on October 14 and TSMC on October 15 bring event risk without a known direction. An hourly close above 31267 puts 31282.75 back in play; if 30982.75 gives way, 30792 is the floor that matters.
Morning review · Oct 12, 7:30 AM EDT
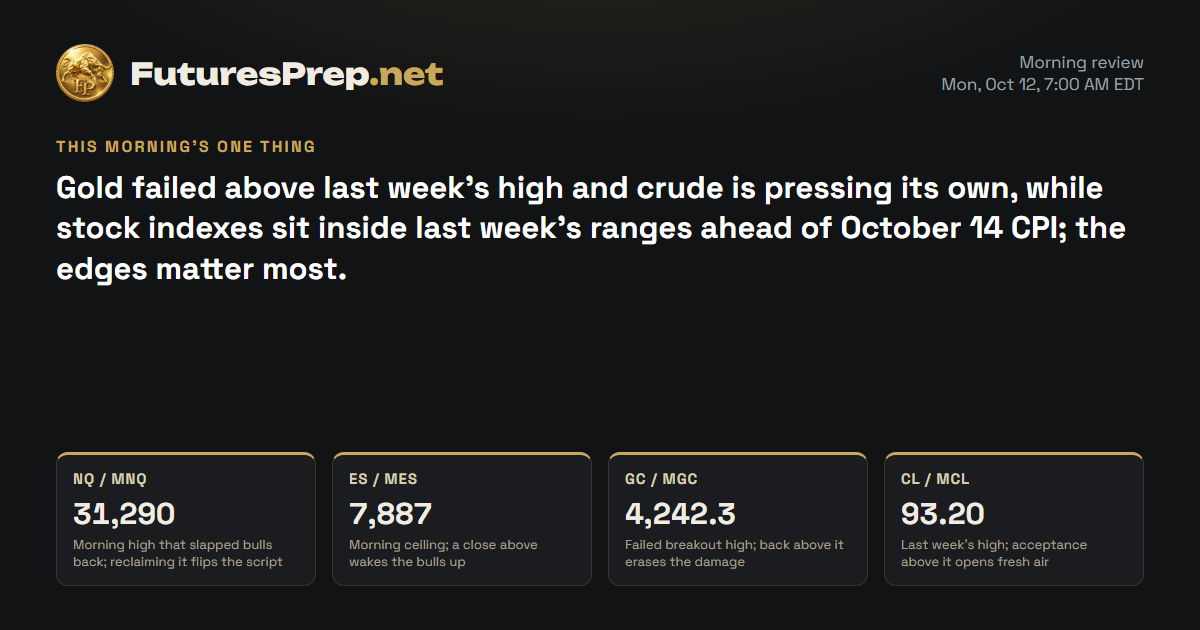
Bears took the first round. Price ran to 31290, got slapped back and bled to 31076.25 near the session low, wiping out the opening gap on the way. Bulls still hold the bigger picture, with the daily average far below at 30696.32, so this is a morning fight, not a collapse. Lose 31038.75 and the road toward 30792 opens; reclaim 31290 and the bears are the ones offside.
Overnight evidence · 10 cited findings
Overnight price action
- From the prior evening baseline, MNQ traded between 31290 and 31038.75 and recorded a net change of -68.25 points.
- Price initially advanced but reversed sharply during the 04:00 hour, closing at 31069.75 below the H1 EMA21.
- The 21.25-point opening gap to 31123.25 was filled overnight.
Overnight events
- No verified scheduled overnight economic release established MNQ direction.
- The October 12 global-markets report was not independently retrievable and is excluded from current-price confirmation.
- CPI, the Beige Book and PPI remain later-week risks rather than explanations for the observed overnight reversal.
What changed
- Morning price action changed from the prior flat read to bearish after rejection from 31290 and loss of the H1 EMA21.
- The filled gap and compression near 31038.75 create a defined downside expansion condition.
- Daily EMA21 support and the absence of verified current macro confirmation temper confidence.
- The baseline was available and the new price action is directional without breaching weekly invalidation.
Index drivers
| Ticker | Approx. weight | Day move | Next earnings | Top headline |
|---|---|---|---|---|
| NVDA | 8.4% | −0.52% | — | Prediction: IonQ Stock Will Double by the End of 2027 |
| MSFT | 5.75% | +2.38% | — | Protiviti Achieves 2026-2027 Microsoft AI Business Solutions Inner Circle Award |
| AAPL | 7.28% | −1.11% | — | These 3 Stocks Are Crushing the "Magnificent Seven" This Year -- Are They Still Buys? |
| AMZN | 4.04% | +3.29% | — | ACCA, SMU launch programme to prepare finance leaders for disruption |
| META | 3.26% | −0.31% | — | S&P 500 Profits Set to Surge More Than 30% in Q3 With AI Giants Dominating Growth |
| AVGO | 2.47% | +0.39% | — | 3 Australian Stocks Trading Up To 43% Below Fair Value |
| GOOGL | 3% | +0.97% | — | Most Tokenized Stock Trading Happens Outside U.S. Market Hours, IMF Finds |
| TSLA | 2.81% | +2.05% | Oct 20 · After close | Tesla (NASDAQ:TSLA) Pairs Strong Growth With a High-Quality Technical Breakout Setup |
The heavyweights split in Friday's October 9 session: Microsoft, Amazon, Alphabet, Tesla and Broadcom closed higher while Nvidia, Apple and Meta slipped. Those quotes are a weekend old and settle nothing about this morning. Tesla is the next big name on the calendar, reporting after the close on October 20.
Market data as of Oct 12, 7:33 AM EDT · Weights as of 2026-09-30
Evidence · 11 cited findings
Price action · weekly / daily / H1
- Flat is the first and controlling record: weekly acceptance above 31282.75 did not hold into the 31123.25 close, and rejection from 31616.5 left two-sided control while 30792 remained intact.
- The daily close remained 0.98 ADR above the 30696.32 EMA21, but the bullish candle used only 0.72 ADR and finished below 31267 resistance.
- H1 recovered from 30792 but stalled around its nearly flat 31127.16 EMA21; the operative balance range is 30982.75-31267.
- The projected overnight scenario rotates from 31155 toward 31065 before recovering toward 31205, with a projected 31130/31310/30955/31195 candle.
Metrics
- The weekly candle spanned 824.5 points and closed as a doji, supporting balance rather than directional acceptance.
- The last completed H1 range was 35.5 points versus a 105-point expansion threshold, and six bars had elapsed since expansion.
- QQQ driver performance was split at the October 9 close: MSFT +2.38% and AMZN +3.29% contrasted with AAPL -1.11% and NVDA -0.52%; weights source: https://www.invesco.com/qqq-etf/en/about.html
- Driver quotes are dated October 9 and cannot establish current Sunday-session momentum.
Sentiment & current events
- TSMC's third-quarter conference is scheduled for October 15 at 02:00 ET, creating semiconductor event risk without a verifiable advance direction: https://investor.tsmc.com/english/quarterly-results/2026/q3
- The verified 3.75%-4.00% policy-rate regime is a valuation headwind, but its next equity reaction is not predetermined: https://www.federalreserve.gov/newsevents/pressreleases/monetary20260916a.htm
- Exact COT positioning was not reproduced from primary CFTC files and is excluded from direction: https://www.cftc.gov/MarketReports/CommitmentsofTraders/index.htm
Sources & evidence dates · 24
- bls.gov
- investor.tsmc.com
- federalreserve.gov2026-09-16
- bsee.gov
- The exact supplied COT values for NQ, ES, GC, and CL could not be independently reproduced from an accessible primary CFTC report. FuturesBench is a secondary transformation, and COT observations dated October 6 are not current-session positioning.
- Yahoo2026-10-12T09:55:00.000Z
- Yahoo2026-10-12T09:54:02.000Z
- Yahoo2026-10-12T09:38:07.000Z
- Yahoo2026-10-12T09:55:00.000Z
- Yahoo2026-10-12T09:34:00.000Z
- Yahoo2026-10-12T09:20:00.000Z
- Yahoo2026-10-12T09:04:00.000Z
- ChartMill2026-10-12T08:22:17.000Z
- Yahoo2026-10-12T06:16:12.000Z
- Yahoo2026-10-12T09:36:33.000Z
- Yahoo2026-10-12T09:22:55.000Z
- Yahoo2026-10-12T09:00:00.000Z
- Yahoo2026-10-12T10:26:01.000Z
- Yahoo2026-10-12T10:00:00.000Z
- Yahoo2026-10-12T09:11:47.000Z
- Yahoo2026-10-12T09:11:35.000Z
- Yahoo2026-10-12T08:55:35.000Z
- SeekingAlpha2026-10-12T04:55:13.000Z
- ChartMill2026-10-12T10:10:58.000Z