Session Prep

Two minutes tonight. A plan tomorrow.
Evening edition · Data as of Thu, Oct 8, 5:00 PM EDT · All times Eastern
Deep research

Tonight's one thing

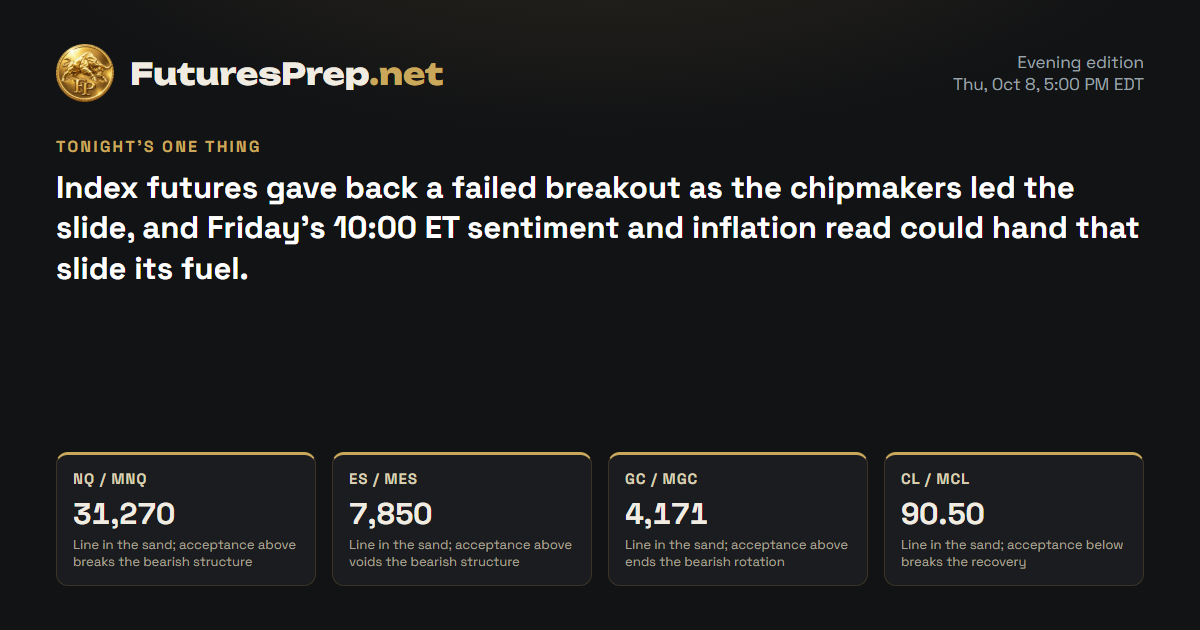
Index futures gave back a failed breakout as the chipmakers led the slide, and Friday's 10:00 ET sentiment and inflation read could hand that slide its fuel.

Tomorrow's market movers · Friday, October 9

Time ETImpactEventForecastPrevious
10:00 AMMediumPrelim UoM Consumer Sentiment47.547.8
10:00 AMMediumPrelim UoM Inflation Expectations—4.6%

U.S. releases, high and medium impact.

NQ / MNQE-mini / Micro E-mini Nasdaq-100Weekly thesis · STRESSED

The Lines in the Sand

31,270Line in the sand; acceptance above breaks the bearish structure
31,060.75Weekly open, now overhead after the failed extension
30,792Session low, the floor the bounce came off

The Trap

The bounce off 30792 looks like strength, and late bulls tend to pile in just as price runs into the 31190-31270 supply. Early shorts get caught the other way when Friday's 10:00 ET data whips price through a level before it settles.

Last price31,021.5
ADR · 30 sessions436.69 pts
Daily EMA2130,647.68HOLD
Reopen gapNo opening gap
30,60030,80031,00031,20031,40031,600close 16:00Fri 9:30close 16:00Mon 9:30close 16:00Tue 9:30close 16:00Wed 9:30close 16:00Thu 9:30close 16:00Prior week high · 31,282.75H1 · EMA21 · NQ / MNQ 31,021.5Yellow: 09:30 open · dashed gray: 16:00 close (ET)

The Read

Bulls broke above the 31282.75 prior-week high, held there, then got thrown out hard. Price tagged 31466.25, got rejected, and slid to 31021.5, back under the 31060.75 weekly open on more than double the usual volume. The hourly closed below its moving average, and the bounce off 30792 left 31190-31270 as the likely supply zone. The counter-case is real: the close still sits above the 30647.68 daily EMA21, and 30760 has not given way. The weight of evidence sits clearly with the bears, but reclaim and hold above 31270 and the bears are offside; lose 30792 and the floor that caught Thursday's slide is gone.

Yesterday's daily candle · Thu, Oct 8
Open31,403.75High31,466.25Low30,792Close31,021.5
bearish · range 674.25 pts
Projected range · next session320 pts30,865 – 31,185

Index drivers

Nvidia, the heaviest name in the group, fell, and Broadcom, Amazon and Microsoft dropped with it. Apple was the lone heavyweight to finish higher, while Meta barely moved and Alphabet and Tesla slipped. Tesla has the only scheduled earnings in the group, October 20 after the close.

Market data as of Oct 8, 6:33 PM EDT · Weights as of 2026-09-30

Evidence · 10 cited findings

Price action · weekly / daily / H1

  • Weekly extension failed after acceptance above 31282.75: price reversed to 31021.5, below the 31060.75 weekly open, with one session remaining.
  • The daily candle was bearish on 2.238 times 30-day average volume, used 1.544 ADR and rejected 31466.25, preserving downside pressure despite closing above the 30647.68 daily EMA21.
  • H1 price closed below its 31160.24 EMA21 after consecutive downside expansions; the recovery from 30792 leaves 31190-31270 as likely supply unless reclaimed.

Metrics

  • The projected session candle is 31021.5 open, 31185 high, 30865 low and 30935 close, internally consistent with the bearish path.
  • The last completed H1 range was 51.75 versus a 105-point expansion threshold, so expansion is not active at baseline.
  • Index-driver breadth supports pressure: NVDA fell 2.9435%, MSFT 1.3497%, AMZN 2.2545% and AVGO 4.3478%, while AAPL rose 1.1139%; weights source: https://www.invesco.com/qqq-etf/en/about.html

Sentiment & current events

  • Higher sovereign yields, firmer oil and weaker equities corroborate the bearish macro backdrop, with technology comparatively exposed to duration pressure: https://www.theguardian.com/business/2026/oct/08/oil-prices-rise-middle-east-tensions-us-hurricane-threat
  • Preliminary October consumer sentiment and inflation expectations are scheduled for 10:00 ET Friday, creating event risk inside the next session: https://www.sca.isr.umich.edu/
  • Hurricane Isaias is a current inflation and volatility risk through potential Gulf disruption: https://www.nhc.noaa.gov/text/refresh/MIATCMAT4+shtml/080251.shtml
  • The announced pause in new U.S. strikes on Iran before November 3 tempers the most aggressive escalation scenario but does not end broader conflict or shipping risk: https://apnews.com/article/trump-iran-war-midterms-attack-422b1799a1a06466279ac265f560e014
Sources & evidence dates · 30
  1. sca.isr.umich.edu
  2. The Federal Reserve calendar shows no FOMC decision on October 9 or October 12; the next scheduled decision is October 28 after an October 27-28 meeting.
  3. federalreserve.gov2026-10-08
  4. treasurydirect.gov2026-10-08
  5. home.treasury.gov2026-08-04
  6. tradingeconomics.com
  7. nhc.noaa.gov2026-10-08T21:00:00Z
  8. apnews.com2026-10-08
  9. Contemporaneous reporting corroborates a sharp oil rise, higher sovereign yields and weaker equities on October 8. This supports the bearish macro pressure in the MNQ and MES price-action read, with MNQ more exposed to duration pressure; the precise relative sensitivity is an inference, not a directly measured fact.2026-10-08
  10. finance.yahoo.com
  11. tradingview.com2026-10-07
  12. Yahoo2026-10-08T21:49:00.000Z
  13. Yahoo2026-10-08T21:13:04.000Z
  14. Yahoo2026-10-08T21:06:02.000Z
  15. Yahoo2026-10-08T21:00:24.000Z
  16. Yahoo2026-10-08T20:26:00.000Z
  17. Yahoo2026-10-08T20:21:28.000Z
  18. Yahoo2026-10-08T21:20:17.000Z
  19. Yahoo2026-10-08T21:05:29.000Z
  20. Yahoo2026-10-08T21:03:42.000Z
  21. Yahoo2026-10-08T20:34:16.000Z
  22. Yahoo2026-10-08T19:48:28.000Z
  23. Yahoo2026-10-08T19:43:03.000Z
  24. Yahoo2026-10-08T21:46:03.000Z
  25. Yahoo2026-10-08T19:42:53.000Z
  26. Yahoo2026-10-08T21:00:00.000Z
  27. Yahoo2026-10-08T18:41:20.000Z
  28. Yahoo2026-10-08T20:10:00.000Z
  29. Yahoo2026-10-08T21:24:00.000Z
  30. Yahoo2026-10-08T21:17:16.000Z
ES / MESE-mini / Micro E-mini S&P 500Weekly thesis · STRESSED

The Lines in the Sand

7,850Line in the sand; acceptance above voids the bearish structure
7,783Session low and bottom of the test zone
7,781.5Weekly open; holding above keeps the week constructive

The Trap

Bears pressing below 7800 can get squeezed, because the weekly structure is still constructive above 7781.5. Bulls chasing pops into 7835-7850 keep running into lower highs on the hourly.

Last price7,822.75
ADR · 30 sessions75.97 pts
Daily EMA217,778.21HOLD
Reopen gapNo opening gap
7,6757,7007,7257,7507,7757,8007,8257,8507,8757,900close 16:00Fri 9:30close 16:00Mon 9:30close 16:00Tue 9:30close 16:00Wed 9:30close 16:00Thu 9:30close 16:00Prior week high · 7,810.5Prior week low · 7,672.75H1 · EMA21 · ES / MES 7,822.75Yellow: 09:30 open · dashed gray: 16:00 close (ET)

The Read

Bulls broke the 7810.5 prior-week high and pushed all the way to 7897.5, then bears dragged price back to 7822.75 on about twice the usual volume. The hourly is printing lower highs under its 7825.78 moving average, and failure beneath 7835-7850 points to another test of 7800-7783. The counter-argument carries weight: the week is still above the 7781.5 open, and the close sits 44.54 points above the 7778.21 daily EMA21. The tilt is bearish, but only a tilt. Reclaim 7850 and the bulls take the wheel back; lose 7781.5 and the week's constructive structure is gone.

Yesterday's daily candle · Thu, Oct 8
Open7,851.5High7,858.25Low7,783Close7,822.75
bearish · range 75.25 pts
Projected range · next session48 pts7,796.5 – 7,844.5

Index drivers

Chipmakers took the worst of it: Micron, Broadcom, AMD and Nvidia all fell hard, and Amazon and Microsoft finished lower too. Apple and Berkshire Hathaway were the heavyweights that closed higher, while Meta barely moved. Tesla has the only scheduled earnings in the group, October 20 after the close.

Market data as of Oct 8, 6:33 PM EDT · Weights as of 2026-10-01

Evidence · 10 cited findings

Price action · weekly / daily / H1

  • Weekly structure remains constructive above the 7781.5 open and accepted above the 7810.5 prior-week high, but the retreat from 7897.5 substantially weakened the breakout.
  • The daily candle was bearish on 2.042 times 30-day average volume, yet its 7822.75 close remains 44.54 points above the 7778.21 daily EMA21.
  • H1 remains below the 7825.78 EMA21 after a lower-high sequence; failure beneath 7835-7850 favors another test of 7800-7783.

Metrics

  • The projected session candle is 7822.75 open, 7844.5 high, 7796.5 low and 7811.25 close, consistent with a modest bearish path that retains a GREEN weekly close.
  • The last completed H1 range was 7 points versus an 18.5-point expansion threshold, so expansion is not active at baseline.
  • Broad driver weakness supports pressure: NVDA fell 2.9435%, MSFT 1.3497%, AMZN 2.2545%, AVGO 4.3478%, MU 4.7941% and AMD 3.8987%, while AAPL rose 1.1139%; weights source: https://www.ssga.com/us/en/intermediary/etfs/state-street-spdr-sp-500-etf-trust-spy

Sentiment & current events

  • Higher sovereign yields, firmer oil and weaker equities corroborate bearish macro pressure: https://www.theguardian.com/business/2026/oct/08/oil-prices-rise-middle-east-tensions-us-hurricane-threat
  • Preliminary October consumer sentiment and inflation expectations are scheduled for 10:00 ET Friday: https://www.sca.isr.umich.edu/
  • Hurricane Isaias creates current Gulf-supply, inflation and volatility risk: https://www.nhc.noaa.gov/text/refresh/MIATCMAT4+shtml/080251.shtml
  • The pause in new U.S. strikes on Iran before November 3 reduces one escalation channel but does not eliminate broader conflict risk: https://apnews.com/article/trump-iran-war-midterms-attack-422b1799a1a06466279ac265f560e014
Sources & evidence dates · 37
  1. sca.isr.umich.edu
  2. The Federal Reserve calendar shows no FOMC decision on October 9 or October 12; the next scheduled decision is October 28 after an October 27-28 meeting.
  3. federalreserve.gov2026-10-08
  4. treasurydirect.gov2026-10-08
  5. home.treasury.gov2026-08-04
  6. tradingeconomics.com
  7. nhc.noaa.gov2026-10-08T21:00:00Z
  8. apnews.com2026-10-08
  9. Contemporaneous reporting corroborates a sharp oil rise, higher sovereign yields and weaker equities on October 8. This supports the bearish macro pressure in the MNQ and MES price-action read, with MNQ more exposed to duration pressure; the precise relative sensitivity is an inference, not a directly measured fact.2026-10-08
  10. finance.yahoo.com
  11. flashalpha.com2026-09-27T20:13:00-04:00
  12. Yahoo2026-10-08T21:49:00.000Z
  13. Yahoo2026-10-08T21:13:04.000Z
  14. Yahoo2026-10-08T21:06:02.000Z
  15. Yahoo2026-10-08T21:00:24.000Z
  16. Yahoo2026-10-08T20:26:00.000Z
  17. Yahoo2026-10-08T20:21:28.000Z
  18. Yahoo2026-10-08T21:20:17.000Z
  19. Yahoo2026-10-08T21:05:29.000Z
  20. Yahoo2026-10-08T21:03:42.000Z
  21. Yahoo2026-10-08T20:34:16.000Z
  22. Yahoo2026-10-08T19:48:28.000Z
  23. Yahoo2026-10-08T19:43:03.000Z
  24. Yahoo2026-10-08T21:46:03.000Z
  25. Yahoo2026-10-08T19:42:53.000Z
  26. Yahoo2026-10-08T21:00:00.000Z
  27. Yahoo2026-10-08T18:41:20.000Z
  28. Yahoo2026-10-08T20:10:00.000Z
  29. Yahoo2026-10-08T21:24:00.000Z
  30. Yahoo2026-10-08T21:17:16.000Z
  31. Yahoo2026-10-08T21:01:00.000Z
  32. Yahoo2026-10-08T19:59:21.000Z
  33. Yahoo2026-10-08T18:18:39.000Z
  34. Yahoo2026-10-08T17:58:39.000Z
  35. Yahoo2026-10-08T17:56:14.000Z
  36. Yahoo2026-10-08T06:01:00.000Z
  37. Yahoo2026-10-08T06:00:00.000Z
GC / MGCGold / Micro GoldWeekly thesis · FULFILLED

The Lines in the Sand

4,171Line in the sand; acceptance above ends the bearish rotation
4,143Prior-week low, broken and held below
4,128.1Session low, bottom of the rotation zone

The Trap

The green daily candle draws bulls in, but it came on light volume and a small range, still far under the 4261.61 daily EMA21. Bears get caught when price pokes above 4170.7 and they lean on it too early.

Last price4,158.4
ADR · 30 sessions97.53 pts
Daily EMA214,261.61REJECT
Reopen gapNo opening gap
4,0804,1004,1204,1404,1604,1804,2004,2204,2404,260close 13:30Fri 8:20close 13:30Mon 8:20close 13:30Tue 8:20close 13:30Wed 8:20close 13:30Thu 8:20close 13:30Prior week low · 4,143H1 · EMA21 · GC / MGC 4,158.4Yellow: 08:20 open · dashed gray: 13:30 close (ET)

The Read

Bears broke the 4143 prior-week low and drove price to 4091.2 before bulls clawed it back to 4158.4. The bounce is real on the hourly, which reclaimed its 4149.87 moving average, but it stalled under 4170.7 on below-average volume. The daily close is still well below the 4261.61 EMA21, so this reads as a countertrend recovery, not a turn. The pause in new U.S. strikes on Iran takes some safe-haven heat out, though broader conflict risk has not ended. Fail under 4171 and the tilt favors rotation back to 4140-4128; accept above 4171 and the bears are offside.

Yesterday's daily candle · Thu, Oct 8
Open4,139.9High4,170.7Low4,128.1Close4,158.4
bullish · range 42.6 pts
Projected range · next session44 pts4,129.5 – 4,173.5
Evidence · 10 cited findings

Price action · weekly / daily / H1

  • Weekly price accepted below the 4143 prior-week low and remains below the 4169.4 weekly open; the recovery from 4091.2 has not repaired the broader downside break.
  • The daily candle was green but closed 1.058 ADR below the 4261.61 daily EMA21, leaving it a countertrend recovery rather than a confirmed reversal.
  • H1 reclaimed its local 4149.87 EMA21 but stalled below 4170.7; compression favors rotation toward 4140-4128 unless 4171 is accepted.

Metrics

  • The projected session candle is 4158.4 open, 4173.5 high, 4129.5 low and 4141.8 close, consistent with a bearish rotation after a limited bounce.
  • The last completed H1 range was 4.7 points versus a 23.9-point expansion threshold, so expansion is not active at baseline.
  • The daily range used only 0.437 ADR and volume was 0.916 times the 30-day average, reducing the evidentiary strength of the green recovery.

Sentiment & current events

  • Hurricane Isaias is a current volatility and inflation risk but is not direct directional proof for gold: https://www.nhc.noaa.gov/text/refresh/MIATCMAT4+shtml/080251.shtml
  • The pause in new U.S. strikes on Iran before November 3 reduces immediate safe-haven escalation pressure, although broader conflict and shipping risks remain: https://apnews.com/article/trump-iran-war-midterms-attack-422b1799a1a06466279ac265f560e014
  • Structural ETF and official-sector demand claims are lagged and cannot override current price action.
  • Conflicting gold reference prices across supplied sources were excluded because instruments and timestamps were not normalized.
Sources & evidence dates · 2
  1. nhc.noaa.gov2026-10-08T21:00:00Z
  2. apnews.com2026-10-08
CL / MCLWTI Crude Oil / Micro WTI Crude OilWeekly thesis · FULFILLED

The Lines in the Sand

90.5Line in the sand; acceptance below breaks the recovery
93.2Session and week high, where the rally got rejected
88.07Prior-week low that got swept and reclaimed

The Trap

Late bears chased the sweep under 88.07 and got caught when price snapped back above it. Now the hurricane headlines pull late bulls in near 93.20, right where the last push already got rejected.

Last price91.17
ADR · 30 sessions4.03 pts
Daily EMA2190.9RECLAIM
Reopen gapNo opening gap
8788899091929394close 14:30Fri 9:00close 14:30Mon 9:00close 14:30Tue 9:00close 14:30Wed 9:00close 14:30Thu 9:00close 14:30Prior week low · 88.07H1 · EMA21 · CL / MCL 91.17Yellow: 09:00 open · dashed gray: 14:30 close (ET)

The Read

Bears swept the 88.07 prior-week low down to 86.85 but could not keep price there, and bulls ran it back to 91.17. The daily candle reclaimed the 90.90 EMA21 on heavy volume, and EIA showed commercial crude stocks drawing down. Hurricane Isaias is the fuel, forecast to strengthen and make landfall early October 10. The counter-case: the close sits only 0.27 above the EMA21, Cushing stocks rose, and part of the weather and geopolitical premium may already be priced in. Hold 90.50-90.90 and the door opens toward 92.00-92.50; lose 90.50 and the recovery is gone.

Yesterday's daily candle · Thu, Oct 8
Open89.05High93.2Low88.73Close91.17
bullish · range 4.47 pts
Projected range · next session1.93 pts90.42 – 92.35
Evidence · 10 cited findings

Price action · weekly / daily / H1

  • Weekly price swept the 88.07 prior-week low but rejected acceptance beneath it and recovered near the 91.73 weekly open, supporting stabilization without confirming a breakout.
  • The daily candle was bullish on 1.703 times 30-day average volume and reclaimed the 90.90 daily EMA21, although the close was only 0.27 above it and price rejected 93.20.
  • H1 momentum cooled after 93.20, but consolidation around the 91.23 EMA21 means holding 90.50-90.90 favors another test of 92.00-92.50.

Metrics

  • The projected session candle is 91.17 open, 92.35 high, 90.42 low and 91.88 close, consistent with a dip followed by renewed upside.
  • The last completed H1 range was 0.71 versus a 0.82 expansion threshold, placing price close to but not yet in expansion.
  • EIA reported commercial crude inventories down 3.2 million barrels to 424.1 million, while gasoline rose about 0.4 million: https://www.eia.gov/petroleum/supply/weekly/archive/2026/2026_10_07/pdf/table1.pdf

Sentiment & current events

  • Hurricane Isaias was at 85 kt in the Gulf, forecast to strengthen to 95 kt and make landfall early October 10, creating verified upside supply and volatility risk: https://www.nhc.noaa.gov/text/refresh/MIATCMAT4+shtml/080251.shtml
  • OPEC confirmed seven participating countries maintained September required-production levels for November: https://www.opec.org/pr-detail/616-4-october-2026.html
  • The pause in new U.S. strikes on Iran before November 3 reduces one immediate escalation channel but does not eliminate broader conflict or shipping risk: https://apnews.com/article/trump-iran-war-midterms-attack-422b1799a1a06466279ac265f560e014
  • Contemporaneous reporting confirms a sharp October 8 oil rise, warning that part of the weather and geopolitical premium may already be embedded: https://www.theguardian.com/business/2026/oct/08/oil-prices-rise-middle-east-tensions-us-hurricane-threat
Sources & evidence dates · 6
  1. eia.gov2026-10-07
  2. eia.gov2026-10-07
  3. OPEC confirms that seven participating OPEC+ countries maintained September 2026 required-production levels for November and scheduled their next review for November 1. The release does not itself substantiate the added assertion that Gulf producers remain below quota because of disrupted exports.2026-10-04
  4. nhc.noaa.gov2026-10-08T21:00:00Z
  5. apnews.com2026-10-08
  6. Contemporaneous reporting corroborates a sharp oil rise, higher sovereign yields and weaker equities on October 8. This supports the bearish macro pressure in the MNQ and MES price-action read, with MNQ more exposed to duration pressure; the precise relative sensitivity is an inference, not a directly measured fact.2026-10-08

Free. Always. Futures trading edge in your inbox.

You're in. Watch your inbox.

We do not send junk mail. We do not spam.